
Figure EV2. Expression levels and transcript lengths of wild‐type rsaA and its derivatives.
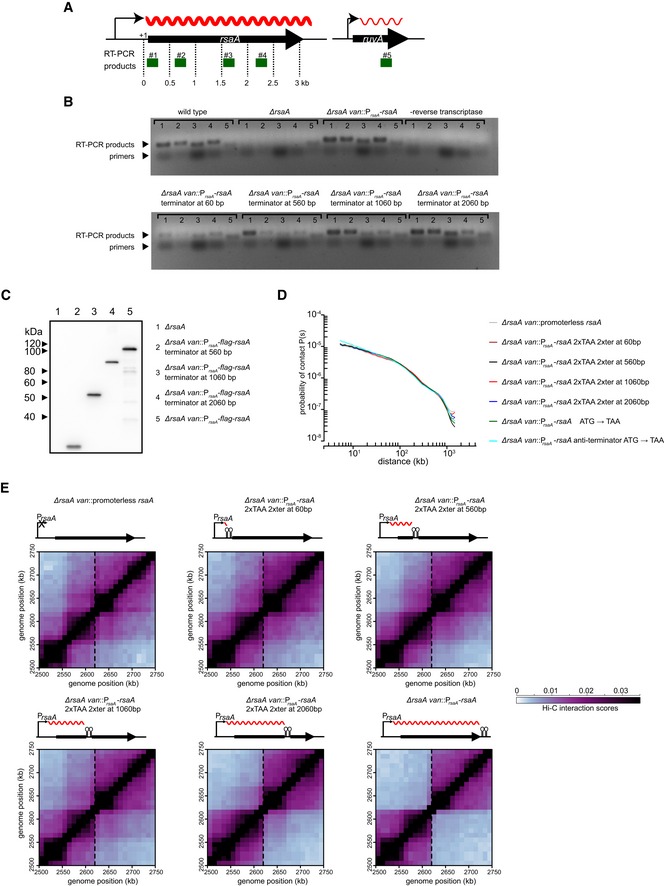
- A schematic showing the location of RT–PCR products (green) examined for rsaA and the ruvA control. Transcripts are denoted as wavy red lines.
- RT–PCR products from RNA extracted from strains harboring the wild‐type rsaA or the derivative indicated. Samples where no reverse transcriptase was added were included to control for genomic DNA contamination.
- Western blot of FLAG‐tagged RsaA and its various derivatives indicated. Anti‐FLAG primary antibody and anti‐mouse secondary antibody were used.
- Expanded view of the region surrounding the site of insertion (dashed line) for each strain examined in Fig 2.