
Figure 4. The effect of inhibiting translation on chromosomal domain boundaries.
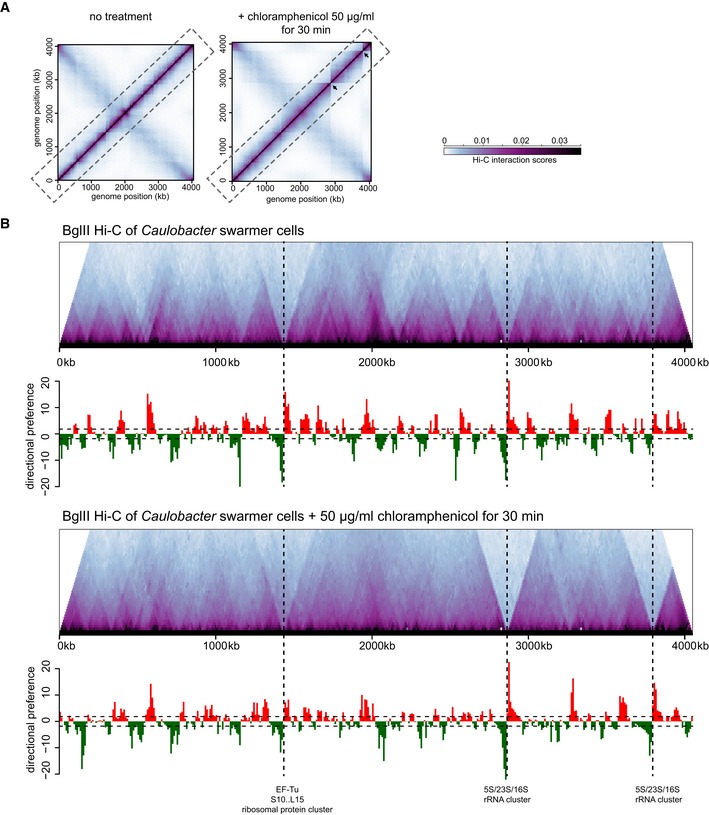
- Normalized Hi‐C contact maps for untreated (left) and chloramphenicol‐treated cells (right).
- Hi‐C contact maps for intra‐chromosomal arm interactions (dashed box in panel A) rotated 45° clockwise with directional preference plots below. Images were resized in each dimension after rotation, but otherwise unprocessed relative to (A). Leftward and rightward preferences are shown as green and red bars, respectively. Vertical dashed black lines indicate the positions of the largest ribosomal protein cluster and the two rRNA loci in the Caulobacter chromosome.