
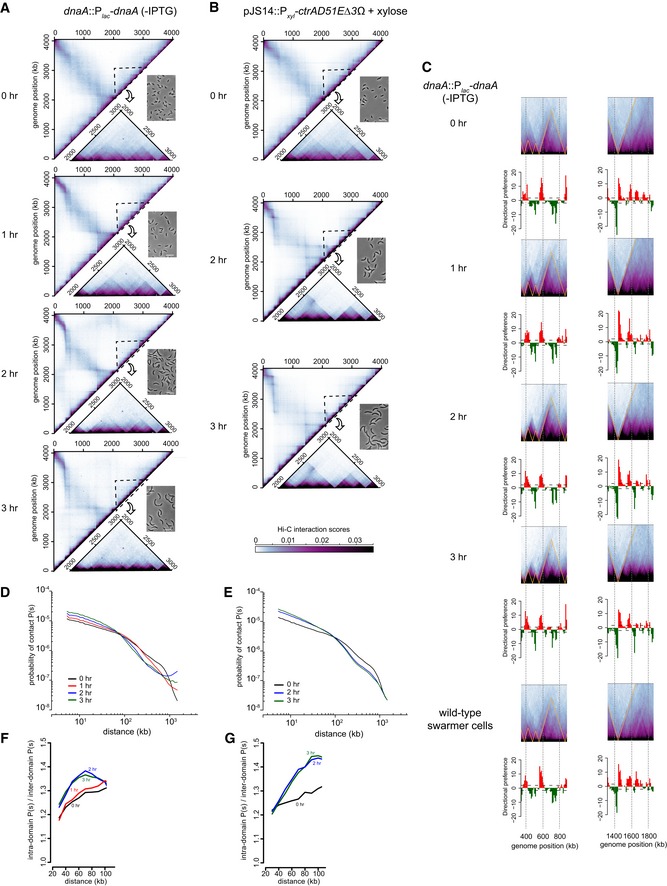
Figure EV4. Hi‐C analysis of elongated Caulobacter cells.
-
AHi‐C maps for cells depleted of DnaA for the times indicated. Only the top left half of each symmetric Hi‐C map is shown with a region outlined shown as an inset along with a representative phase contrast micrograph of cells from each time point.
-
BSame as (A) but for cells overproducing CtrA(D51E)Δ3Ω.
-
CSame portion of the Hi‐C maps shown in Fig 6A and B corresponding to the locations of loci examined by microscopy, but with directional preference plots below each panel.
-
D, EDNA–DNA contact probability P(s), plotted against genomic distance for (D) DnaA‐depleted cells, or (E) cells overproducing CtrA(D51E)Δ3Ω at different time points after synchronization.
-
F, GPlots show the ratio of P(s) values at length scales up to 100 kb for locus–locus interactions within and between domains for (F) DnaA‐depleted cells or (G) cells overproducing CtrA(D51E)Δ3Ω at different time points after synchronization.