-
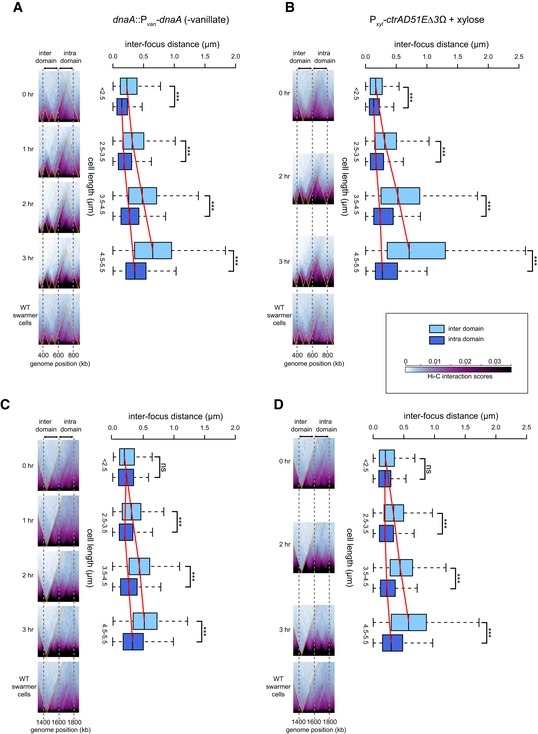
A
Pairs of loci were labeled with YFP‐ParBp
MT
1/parS
p
MT
1 and mCherry‐ParBP
1/par
SP
1 at genomic positions 400 and 600 kb (inter‐domain) or at 600 and 800 kb (intra‐domain).
-
B
Same as (A) but for a strain producing CtrA(D51E)Δ3Ω.
-
C, D
Same as (A and B), but with pairs of loci labeled with YFP‐ParBp
MT
1/parS
p
MT
1 and mCherry‐ParBP
1/par
SP
1 at genomic positions 1,400 and 1,600 kb (inter‐domain) or at 1,600 and 1,800 kb (intra‐domain). Note that differences in Hi‐C chromosomal domain sharpness reflect differences in interaction patterns as the color scale and image contrast settings are identical across each time series.
Data information: Box plots show the distribution of inter‐focus distances for cells of different sizes. Asterisks indicate statistical significance (***
P‐value < 0.001; ns, not significant; Student's
t‐test). For the region of the chromosome containing the labeled loci (indicated by dashed gray lines), the corresponding region of the Hi‐C map generated at each time point indicated is shown, with the same region from wild‐type cells shown at the bottom. For complete Hi‐C maps, see Fig
EV4; for representative microscopy images, see
Appendix Fig S3.