
Figure 7. Model of chromosomal domain boundary formation in the Caulobacter chromosome.
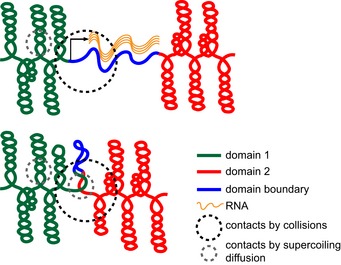
Compacted chromosomal interaction domains (red and green) are connected by a domain boundary denoted as a blue line. (Top) High rates of transcription that produce a relatively long (> 2 kb) transcript (wavy orange lines) locally decompact the DNA, thereby creating a spatial gap between flanking loci. This spatial separation diminishes the long‐range contacts that can occur within a fixed sphere (black dotted circle), leading to the domain boundaries visible by Hi‐C analysis. High rates of transcription can also prevent supercoil diffusion, helping to limit DNA–DNA interactions on a shorter length scale (gray dotted circle). (Bottom) In the absence of transcription, DNA at a domain boundary (blue) will become more compacted, reducing the spatial separation between adjacent domains, and enabling supercoil diffusion, thereby promoting long‐ and short‐range contacts, respectively.