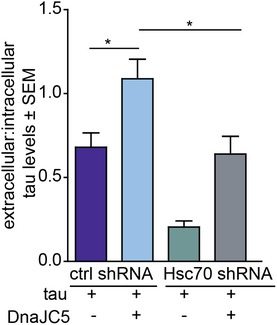
Figure EV5. Ratio of extracellular to intracellular tau levels.

Alternative quantification of Fig 6D showing extracellular tau levels relative to intracellular tau levels. The ratio is shown as average ± SEM, n = 3, *P < 0.05 one‐way analysis of variance with Tukey's multiple comparison post hoc analysis.
