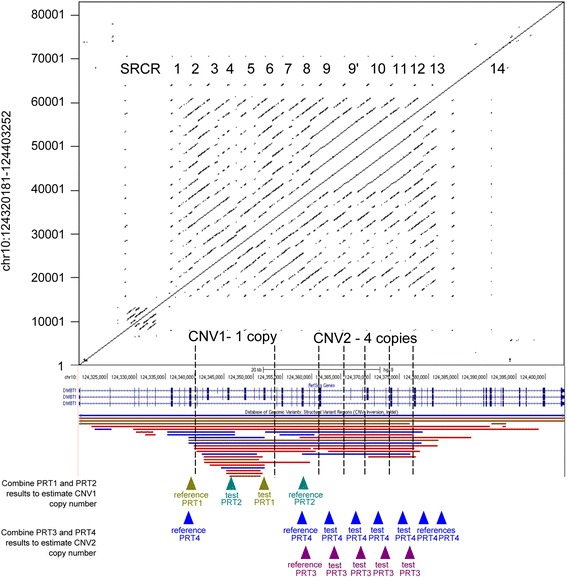
Fig. 1.

Overview of copy number variation within the DMBT1 gene. The top half shows a dot plot of the DMBT1 gene (shown below, in blue, from a screenshot from the UCSC genome browser) aligned against itself. Black dots indicate regions of sequence identity, with the diagonal lines showing the tandemly-repeated nature of the DMBT1 gene. The tandemly-arranged SRCR repeat regions are annotated as numbers on this dot plot, including SRCR14 which does not bind bacteria [44]. The bottom half shows the genome assembly of the DMBT1 gene, with one assembled copy of CNV1 and four assembled copies of CNV2. CNV regions, as recorded in the Database of Genomic Variants, are shown below the DMBT1 gene structure. Below these, location of reference and test amplicons of the four independent paralogue ratio tests (PRTs) that measure copy number of CNV1 and CNV2 are shown
