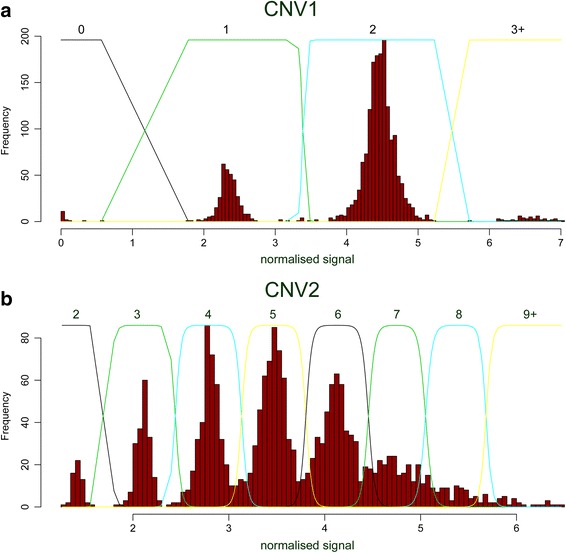
Fig. 3.

Raw copy number histograms and Gaussian mixture models. Raw copy number data, plotted as a histogram, for a CNV1 and b CNV2. The normalised signal, shown on the x-axis, reflects raw average PRT values normalised so that the overall standard deviation of the data is 1. Lines indicate the Gaussian mixture model fit, with numbers above each curve indicating the diploid copy number inferred
