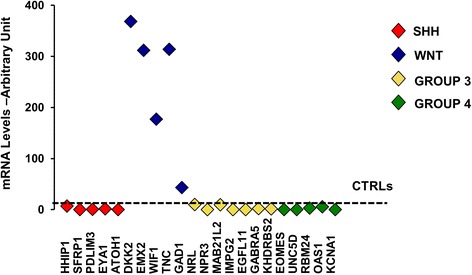
Fig. 2.

Molecular characterization of medulloblastoma. mRNA levels of the indicated genes in medulloblastoma are compared to normal cerebellum as control (CTRLs). Genes are grouped into four molecular subgroups (WNT, SHH, GROUP 3, GROUP 4) as indicated by the four different colors. Relative quantification values are expressed as linear scale arbitrary units
