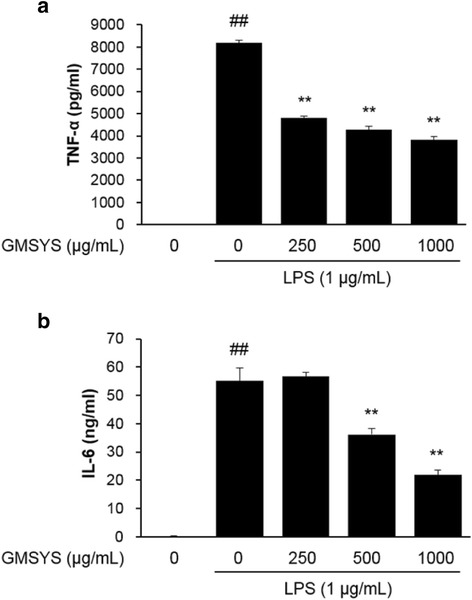
Fig. 5.

Effect of GMSYS on the production of TNF-α and IL-6 in LPS-stimulated RAW 264.7 macrophages. The macrophages were pretreated with GMSYS (0, 250, 500, or 1000 μg/mL) for 4 h and then treated with LPS (1 μg/mL) for 20 h. ELISAs were used to determined levels of (a) TNF-α and (b) IL-6 in collected supernatants. Bar graphs represent the means from three independent experiments. ## P < 0.01 vs vehicle-treated cells and ** P < 0.01 vs LPS-treated cells
