FIGURE 7.
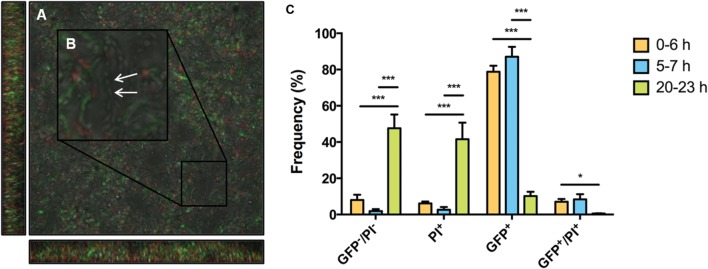
Microscopy and quadrant analysis of S. mutans biofilm with PcomX-gfp reporter and propidium iodide (PI) staining. At 23 h, S. mutans wild-type carrying a PcomX-gfp reporter were visualized after the addition of 2 μM XIP for 3 h. Cells were also simultaneously stained with PI to discriminate between live cells and those with compromised membranes (PI+). Images were obtained at 63X magnification. (A) GFP, PI, brightfield channels were merged. (B) An area was selected and increased in size to allow the discrimination of different cell phenotypes, including live cells that were not responding to XIP (white arrow). (C) Biofilm populations at selected time points sorted into four distinct phenotypes by flow cytometry. The four quadrants represent the percentage (of total cells counted) GFP positive cells, PI positive cells, GFP and PI positive cells and GFP and PI negative cells. At 0–6 h 200 nM XIP was used to induce PcomX-gfp activity, whereas 2 μM XIP was used at the 5–7 h and 20–23 h time points. The statistical significance of differences between time points in distinct sub-populations was calculated using two-sample (unpaired) t-tests (∗P ≤ 0.05; ∗∗∗P ≤ 0.001).

