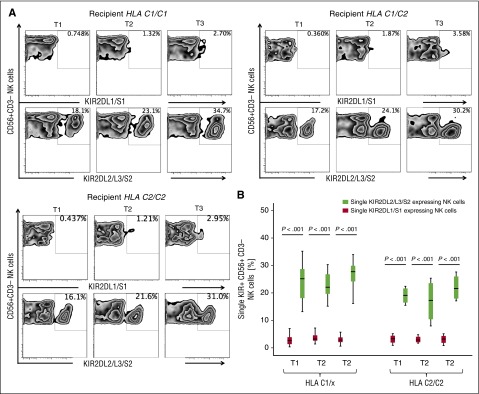
Figure 2.
KIR2DL2/L3/S2-expressing NK cells dominate the reconstituting NK repertoire after CBT. (A) Representative fluorescence-activated cell sorter plots of reconstituting KIR2DL1/S1 and KIR2DL2/L3/S2 expressing NK cells in PBMCs from 7 HLA-C1/C1, 9 HLA-C1/C2, and 4 HLA-C2/C2 patients collected at different post-CBT intervals (median times 50.0 [T1], 97.5 [T2], and 189.5 [T3] days). (B) Frequency of KIR2DL2/L3/S2 vs KIR2DL1/S1 expressing NK cells at different time points post-CBT. Box plots represent the first and third quartiles, and lines inside the boxes represent the median values; whiskers extend to 1.5 times the interquartile range.

