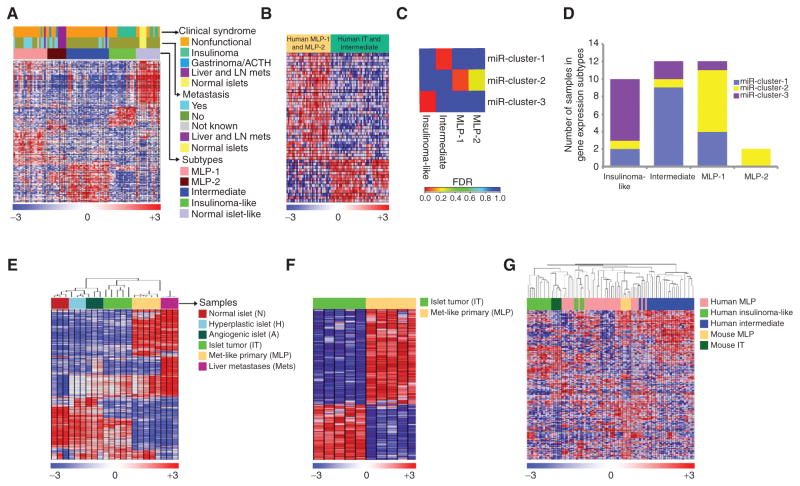
Figure 2.
Gene expression subtypes and cross-species analysis of human and mouse PanNETs. A, heatmap of human PanNET samples showing subtypes defined by gene expression differences, and the association of these subtypes with distant metastasis and clinical syndrome. The subtypes are defined by sets of genes—signatures—that are listed in the same order in Supplementary Table S1C and labeled as “PanNETassignermRNA signatures” (genes were selected using SAM analysis with Δ = 11.1 and FDR < 0.05). ACTH represents ectopic adrenocorticotropic hormonesecreting tumor. B, the heatmap shows genes (listed in Supplementary Table S1D) that were commonly expressed/repressed in human MLP-1 and MLP-2 subtypes and inversely expressed in tumors of the other two subtypes (genes were selected using SAM analysis with Δ = 1.7 and FDR < 0.05). C, enrichment of miRNA subtype samples in gene expression subtype samples was assessed using the hypergeometric test (red represents a significant enrichment of samples between miRNA and gene expression subtypes with FDR < 0.05). D, a bar plot displays the total number of miRNA subtype samples in each gene expression subtype. E and F, heatmaps of RT2 mouse PanNET samples showing gene expression profile differences. E, the distinct stages of tumorigenesis in the RT2 mouse model are shown, including IT, MLP, and liver metastasis (mets) samples. Genes (908 genes selected with SD > 0.8, and highest variable probe across samples in the cases where multiple probes per gene were present) and samples are listed in the same order in Supplementary Table S1F. F, mRNAs that clearly delineate the two subtypes—IT and MLP—are shown. The rows indicate 394 differentially expressed genes (genes were selected using SAM analysis with Δ = 0.6 and FDR < 0.05) among the profiled genes of 10 samples. These genes define “m-PanNETassigner-mRNA” signature, with the individual genes listed in the same order in Supplementary Table S1G. G, heatmap showing cross-species analysis and association of human and mouse PanNET subtypes using ComBat-merged gene expression profiles of RT2 mouse (n = 10) and patient (n = 72) PanNET samples. In all the heatmaps, the rows indicate differentially expressed genes (Supplementary Table S1H) among the profiled gene expression data. In the rainbow bar beneath the heatmaps, red indicates elevated expression, blue decreased, and white no change.

