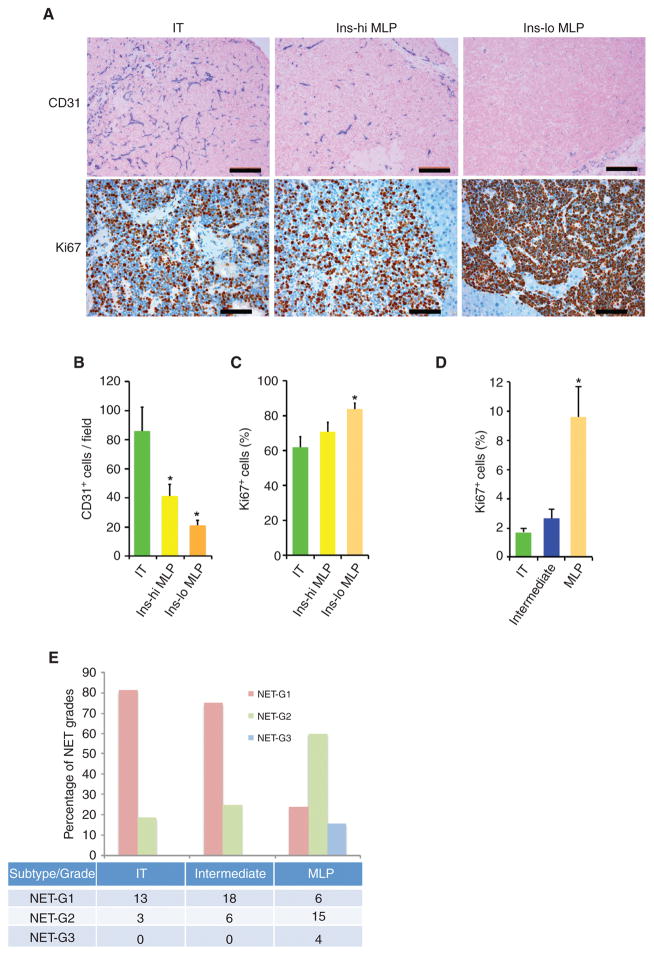
Figure 4.
Vascular and proliferative characteristics of human and mouse PanNETs. A, CD31 (top) and Ki67 (bottom) staining in RT2 tumor subtypes. Images are representative of the analysis of 60 tumor-bearing RT2 B6, B6AF1, and B6D2F1 mice (see Methods section for different strains of the RT2 mouse model). In the top plot, blue represents CD31, pink represents nucleus, and scale bar represents 200 μm; in the bottom plot, red represents Ki67, blue represents nucleus, and scale bar represents 100 μm. B and C, quantification of CD31-positive blood vessels (B) and Ki67-positive tumor cells (C) in different subtypes of RT2 tumor subtypes. The quantitation is representative of the analysis of 10 random fields from 10 different tumor-bearing RT2 B6, B6AF1, and B6D2F1 mice from the analysis illustrated in A. D, percentage of Ki67-positive cells in human PanNET subtypes (from the samples of the core clinical gene expression dataset; see Methods section for detailed description about quantitation). * represents statistical P value < 0.05 as measured using the Student t test comparing IT versus Ins-hi MLP and IT versus Ins-lo MLP. Error bars in the graphs represent SD. E, identifiable percentage and summary (number of samples in the table) of NET grades in human Pan-NET subtypes. NET grades are significantly (P < 0.05; Fisher exact test) associated with PanNET subtypes.

