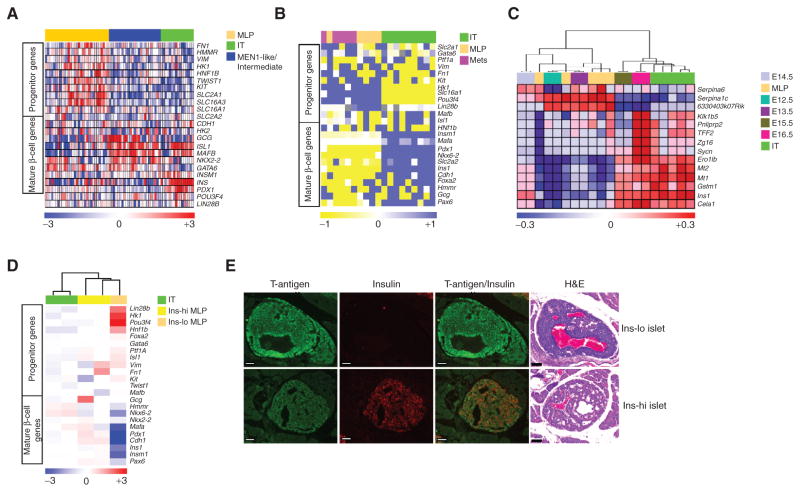
Figure 5.
Stem cell and differentiated phenotypes of PanNET subtypes. A and B, heatmaps showing differential expression of genes that distinguish islet progenitor cells from differentiated β cells, as well as metabolic pathway genes (including metabolic genes that are disallowed in mature β cells; ref. 46) showing differential expression, in PanNET samples from (A) human and (B) mouse. Human PanNET data are from gene expression microarrays, whereas mouse PanNET data are from RT-PCR analysis. The relative (to housekeeping gene PPIA) gene expression from mouse PanNET RT-PCR data was multiplied by 10,000 units before performing the heatmap analysis. Gray color in the heatmap of B represents not available value. C, heatmap comparing the ComBat-merged gene expression profile datasets of IT and MLP subtypes from the RT2 mouse model versus embryonic pancreas (from stages e12.5 to e16.5; data from GSE8070). D, heatmap showing differential expression of genes (measured using microarrays) distinguishing islet progenitor cells from differentiated β cells, as well as variably expressed metabolic pathway genes, in mouse LCM-derived tissue samples from IT, Ins-hi MLP, and Ins-lo MLP PanNET tumor sections, from Fig. 3D and E. E, hyperplastic/dysplastic islets in pancreas tissue sections from RT2 mice showing regions of Ins-lo (top) and Ins-hi (bottom) islets, as visualized with hematoxylin and eosin (H&E) and insulin staining. Images are representative of the analysis from 12 tumor-bearing RT2 mice (8–10 weeks of age). Scale bar, 50 μm.

