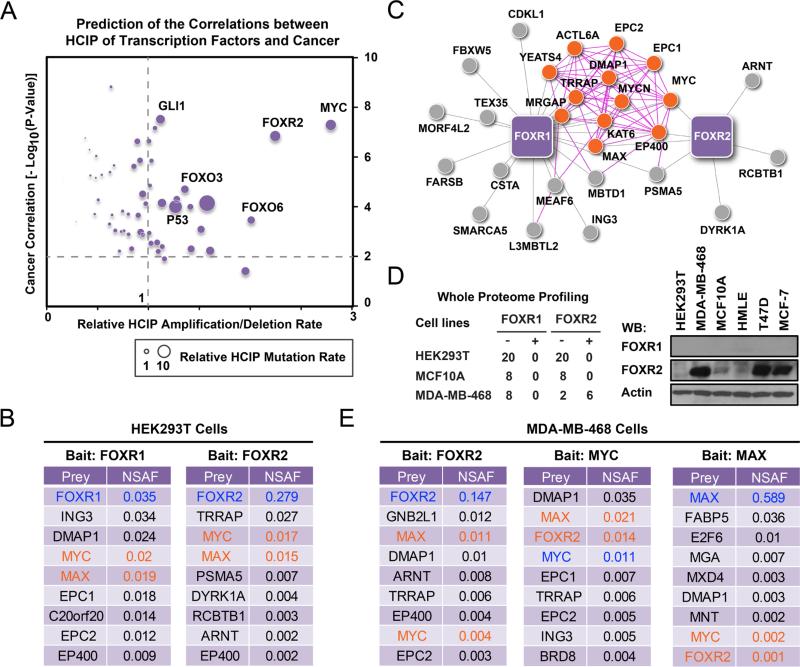
Figure 1. FOXR2 forms a stable complex with MYC/MAX.
(A) Prediction of transcription factors' involvement in tumorigenesis is based on their HCIPs identified by TAP-MS analysis. The cancer correlations were generated by searching the HCIP datasets of each transcription factors in the knowledge base to estimate the significance of these correlations. Transcription factor interactomes were searched for their alteration (numbers and rates) in multiple TCGA databases using their HCIP sets. X axis indicates the relative average expression alteration of indicated TF HCIP dataset in multiple TCGA databases. Y axis indicates cancer correlation for each transcription factor, estimated on the basis of their HCIPs identified in chromatin fractions. The size of each dot indicates the relative average mutation rate of TF HCIP dataset in multiple TCGA databases. (B) Top HCIPs of FOXR1 and FOXR2 in HEK293T cells are listed together with their NSAF values. Baits are highlighted in blue; MYC and MAX are highlighted in orange. (C) Schematic representation of FOXR1 and FOXR2 interactomes with top-ranked interacting proteins. The interaction networks were visualized using unweighted force-directed distributions. Purple lines indicate interactions defined by the literature. Grey lines indicate newly identified interactions on the basis of the results of our proteomic study. Orange dots indicate MYC-MAX complex members reported in the literature. (D) FOXR2 expression in HEK293T, MCF10A and MDA-MB-468 cells were evaluated using whole proteome profiling and WB analysis with antibodies against endogenous FOXR2. (E) TAP-MS was performed with MDA-MB-468 cells that stably expressed SFB-tagged FOXR2, MYC, or MAX. Top-ranked interacting proteins are listed together with their NSAF values. Baits are highlighted in blue; prey FOXR2, MYC, and MAX are highlighted in orange. (B and E) All the data listed here are statistical significant.

