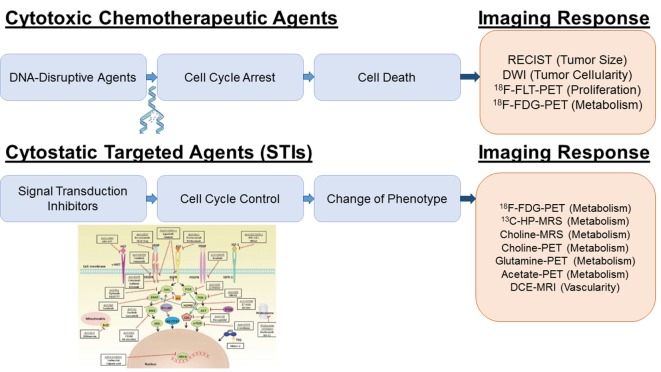
Figure 1.
Imaging platforms for treatment response to cytotoxic and cytostatic agents. For DNA disrupting agents (“Cytotoxic Chemotherapeutic Agents”), increased ADC values by DWI and decreased FLT and FDG uptake by PET reflect a cytotoxic treatment response due to the decreased in tumor cellularity, DNA synthesis and metabolism. For receptor tyrosine kinase inhibitors and PI3K/AKT/mTOR inhibition (“STIs”), a specific early decrease in glycolytic activity has been reported; therefore, glucose imaging using hyperpolarized 13C-pyruvate MRSI or FDG-PET is most sensitive. Inhibition of the Kennedy pathway as monitored by decreased total choline MRSI or 11C-/18F-choline PET is a putative marker for the treatment response of Ras/Raf/MEK/MAPK inhibitors. Glutamine and acetate imaging can be useful for c-myc and FASN inhibitors, respectively. For antiangiogenic agents (VEGF/VEGFR2 inhibitors), DCE-MRI is the technique of choice to assess decreased perfusion and vascularity. The picture was partially adapted from Munagala et al. (7).

