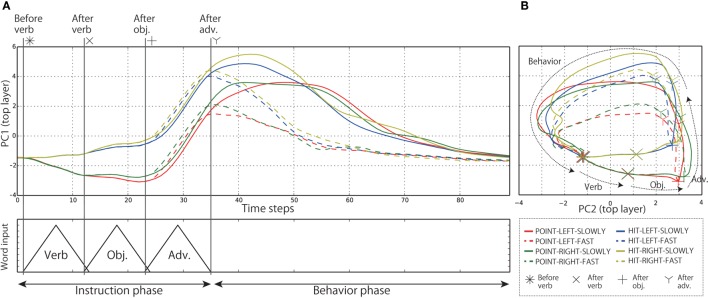
Figure 8.
(A) The time development of the internal states in the top layer in the PC1 direction. Each line expresses the time development averaged over all the episodes in which each behavior was generated during evaluation. The episodes in which the instruction consists of four words were excluded. The internal states of the top layer develop along branches corresponding to the meaning of the input words. (B) The same time development projected onto PC1–PC2 space. The cyclic structure directly representing the temporal flows of interaction, which consist of the repetition of instruction recognition and behavior generation, can be seen. This representation corresponds to the top panel of Figure 1.

