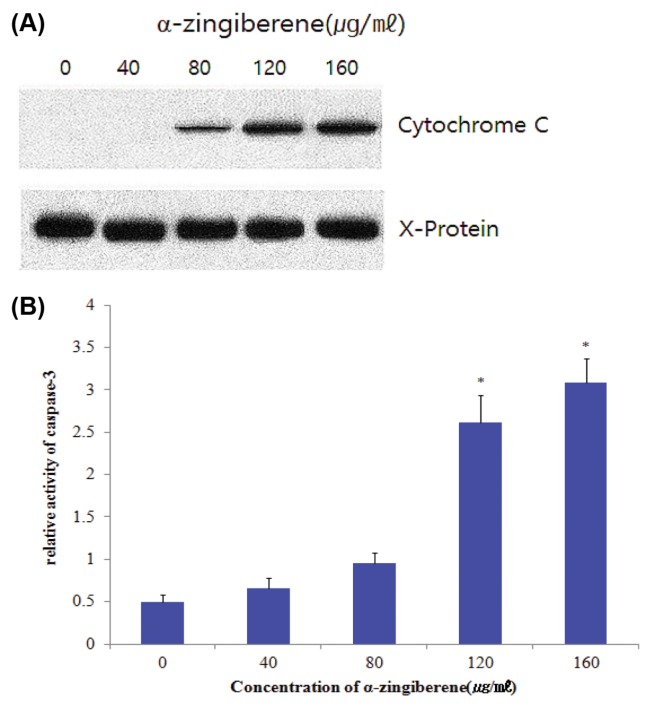
Fig. 4.
Induction of cytochrome c release and caspase-3 activity by α-zingiberene. SiHa cells were treated with each concentration of by α-zingiberene for 24 hr. (A) Mitochondrial cytochrome c was detected by anti-cytochrome c monoclonal antibody. The aggregated cytochrome c, X-protein bends were used to normalize the protein loading. (B) Caspase-3 activity was measured by reading samples in fluorescence microplate reader. Data represents relative activity of caspase-3 after normalization with protein amounts. Data indicate mean values of four replicates, with bars indicating s.e.m. *p < 0.05 compared to control.

