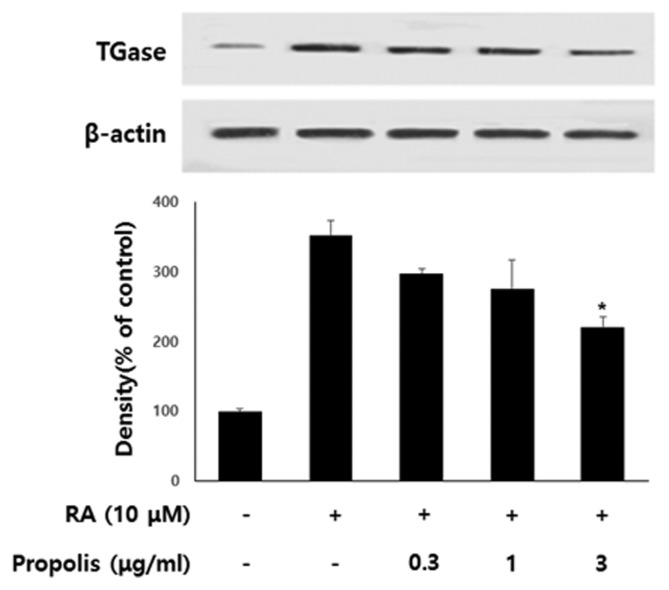
Fig. 3.
Effect of propolis on the expression of TGase in differentiating SH-SY5Y cells. The cells were treated with various concentrations of RA (10 μM) and propolis for 48 hr. The Western blot data represents one of three experiments. Densitometric analysis was performed to determine the intensity of TGase bands. Values are normalized to β-actin band and expressed as the percentage of cells treated with retinoic acid (RA) only. Data are mean ± standard error of three independent experiments. *p< 0.05 when compared to RA-treated cells.

