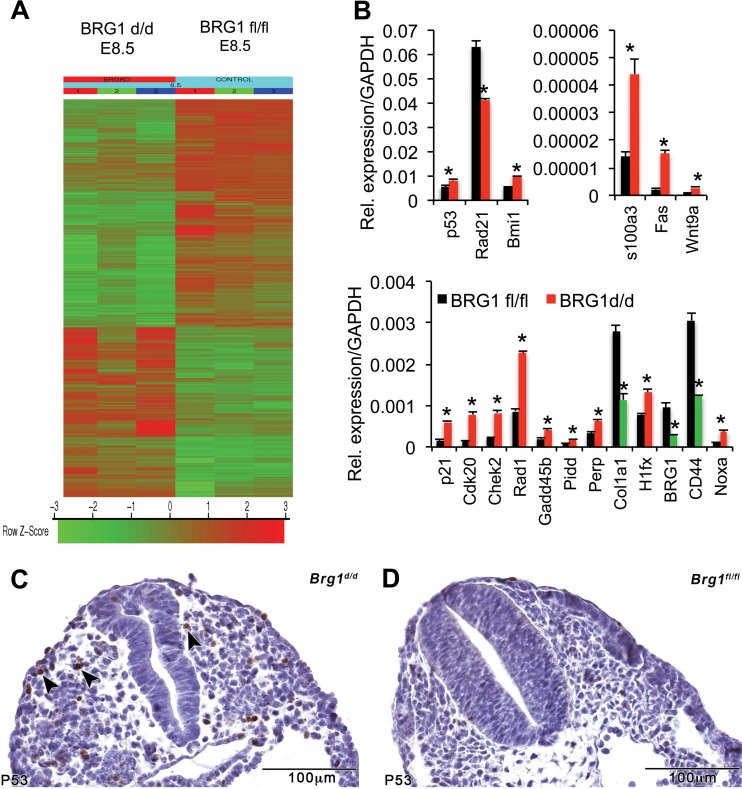
FIG 6.
Brg1 deficiency results in differential expression of the genes related to cell growth and apoptosis. (A) Heat map in which induced genes are indicated in shades of red and repressed genes are indicated in shades of green. The results for triplicate samples are shown. (B) The levels of expression of cell growth- and apoptosis-related genes significantly change in Brg1d/d embryos. *, P < 0.05. Quantitative PCR analysis shows the expression level of mRNA of the indicated genes in Brg1fl/fl and Brg1d/d embryos at E8.5. The levels of mRNA were normalized to those of GAPDH, which was used as a control. Data are expressed as the mean ± SD. *, statistically significant changes (P < 0.05). The data from three biological replicates are shown. Red, induced genes; green, repressed genes. (C, D) Immunohistochemistry shows the comparative positivity of Brg1fl/fl and Brg1d/d embryos for the p53 protein. Arrowheads, positively stained cells.

