FIG 7.
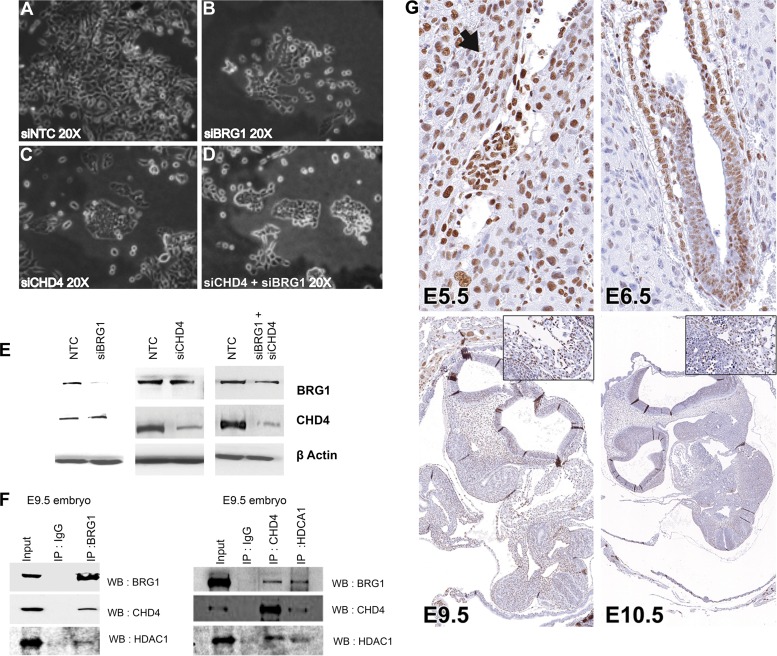
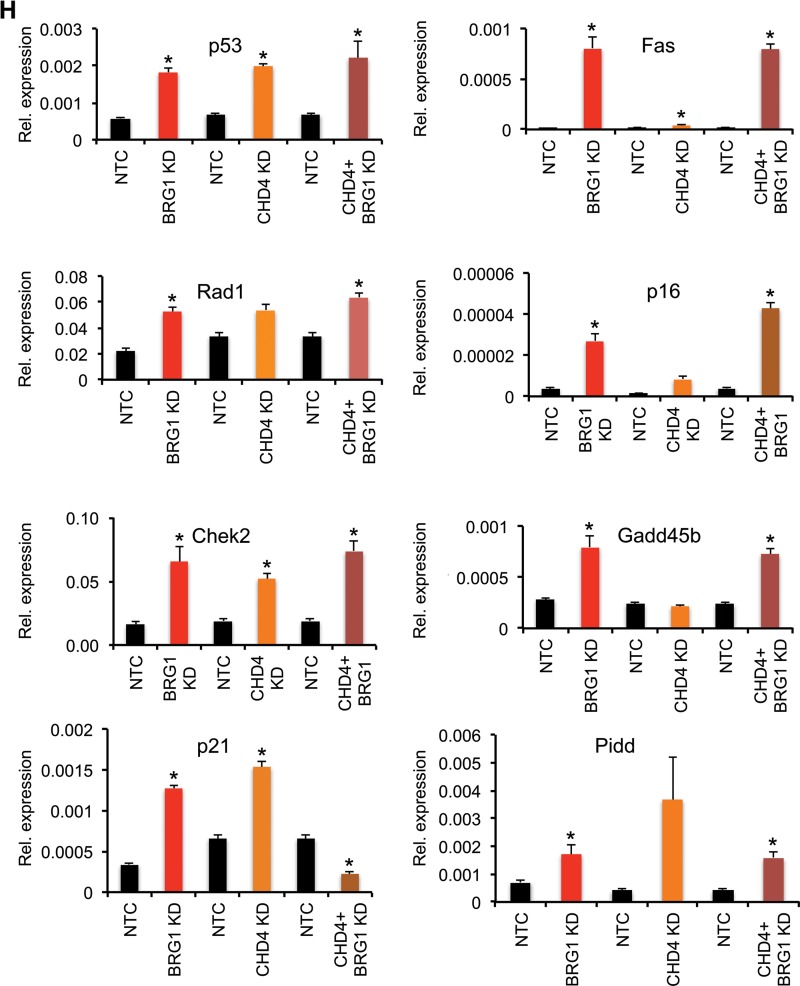
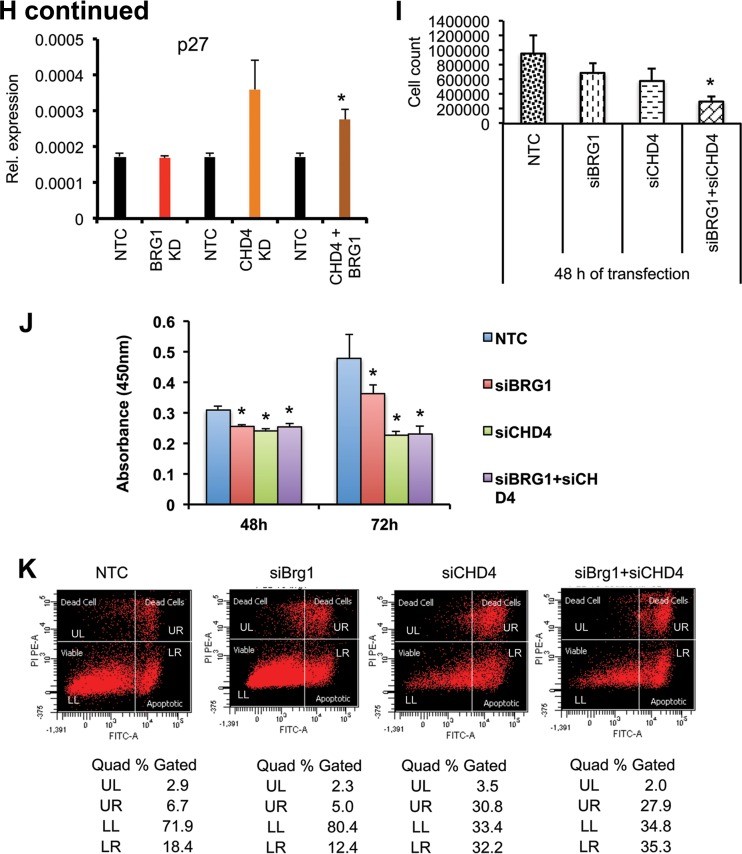
Brg1 and CHD4 knockdown results in reduced cell growth of P19 cells. (A to D) Phenotypes of P19 cells independently transfected with siRNA specific for NTC (siNTC), Brg1 (siBrg1), CHD4 (siCHD4), and both CHD4 and Brg1 (siCHD4 + siBrg1). Brg1 and CHD4 inhibition resulted in a smaller colony size compared to that for the control. (E) Western blots show the extent of protein knockdown of Brg1 and CHD4 in P19 cells. β-Actin was used as a loading control. (F) Brg1, CHD4, and HDAC1 physically interact in the developing embryo, as shown by immunoprecipitation (IP) using antibodies against Brg1, CHD4, HDAC1, and IgG in early embryonic tissue, followed by probing with antibodies against Brg1, CHD4, and HDAC1. WB, Western blotting. (G) Immunohistochemistry of CHD4 shows its expression pattern in early embryos. The arrow and high-magnification insets show CHD4-positive staining. Magnifications: E5.5, ×40; E6.5, ×40; E9.5, ×4.3 (inset, ×40); E10.5, ×3.7 (inset, ×40). (H) Cell growth inhibitor- and apoptosis-related genes are induced in Brg1- and CHD4-knockdown (KD) P19 cells. Quantitative PCR analysis of expression of mRNA of the indicated genes in P19 cells transfected with siRNA specific for the nontarget control versus siRNA specific for Brg1, CHD4, and both Brg1 and CHD4. *, statistically significant changes (P < 0.05). mRNA levels were normalized to the level of GAPDH mRNA as a control; data are expressed as the mean ± SD and represent data from three biological replicates. (I, J) Brg1 and CHD4 silencing reduces P19 cell proliferation. P19 cells were separately transfected with siRNA specific for Brg1, CHD4, both Brg1 and CHD4, or NTC. Cell growth was quantified using the CCK-8 cell viability assay. Values are the means ± SDs for biological replicates. *, P < 0.05. (K) Effects of CHD4 but not Brg1 gene silencing on P19 cell apoptosis. P19 cells were transfected with siRNA specific for NTC, Brg1, CHD4, or Brg1 and CHD4 and serum starved for 24 h, and then apoptosis was quantified by flow cytometry using annexin V-FITC-PI staining. Quad, quadrant; UL (upper left), dead cells; UR (upper right), late-phase apoptosis; LL (lower left), viable cells; LR (lower right), apoptosis.


