. 2016 May 19;8:ecurrents.outbreaks.322427f4c3cc2b9c1a5b3395e7d20894. [Version 1] doi: 10.1371/currents.outbreaks.322427f4c3cc2b9c1a5b3395e7d20894

Simulations of an outbreak with a community-level screening intervention.
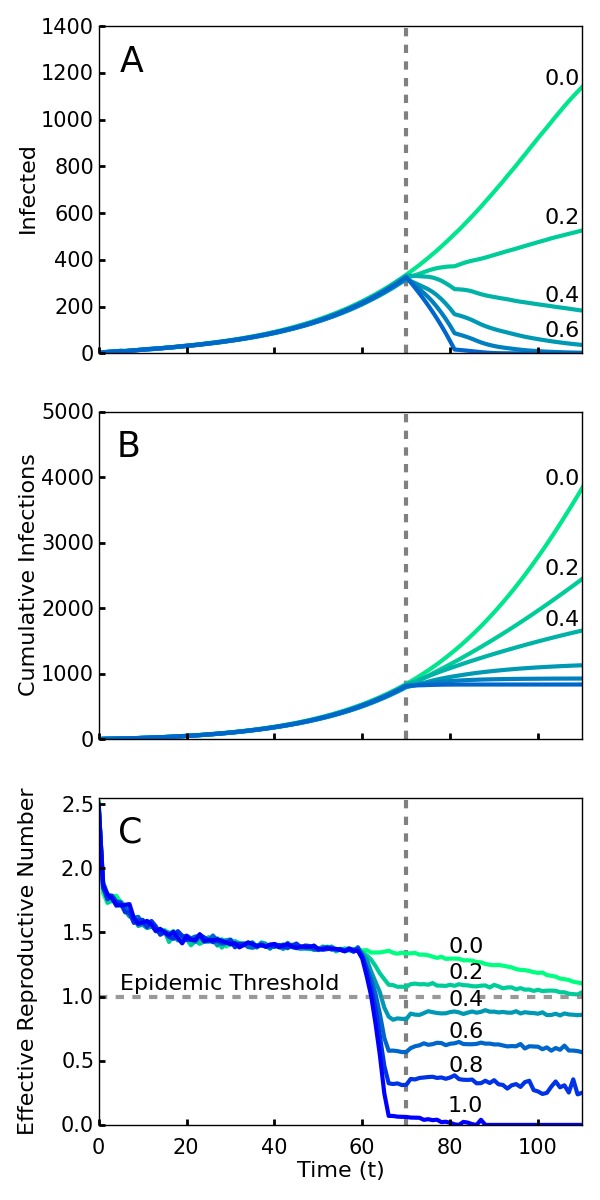
Screening begins at the vertical dotted line, with a level of compliance indicated by label and color (green $0$ to blue $1.0$). A. Number of cases with or without symptoms. Note that even 40\% compliance (0.4) results in decrease in cases. B. Cumulative cases. C. $R_t$, the effective reproductive number---the average number of individuals infected by an index case at time $t$. For an epidemic to continue to grow, $R_t$ must exceed 1. For 40\% compliance (0.4) and greater, $R_t$ decreases below one, corresponding with a decrease in active cases. $R_t$ drops before $t = 70$ because policies affect the contagion of individuals that are initially infected prior to the intervention.

Screening begins at the vertical dotted line, with a level of compliance indicated by label and color (green 0 to blue 1.0). A. Number of cases with or without symptoms. Note that even 40% compliance (0.4) results in decrease in cases. B. Cumulative cases. C. Rt, the effective reproductive number---the average number of individuals infected by an index case at time t. For an epidemic to continue to grow, Rt must exceed 1. For 40% compliance (0.4) and greater, Rt decreases below one, corresponding with a decrease in active cases. Rt drops before t = 70 because policies affect the contagion of individuals that are initially infected prior to the intervention.