. 2016 May 19;8:ecurrents.outbreaks.322427f4c3cc2b9c1a5b3395e7d20894. [Version 1] doi: 10.1371/currents.outbreaks.322427f4c3cc2b9c1a5b3395e7d20894

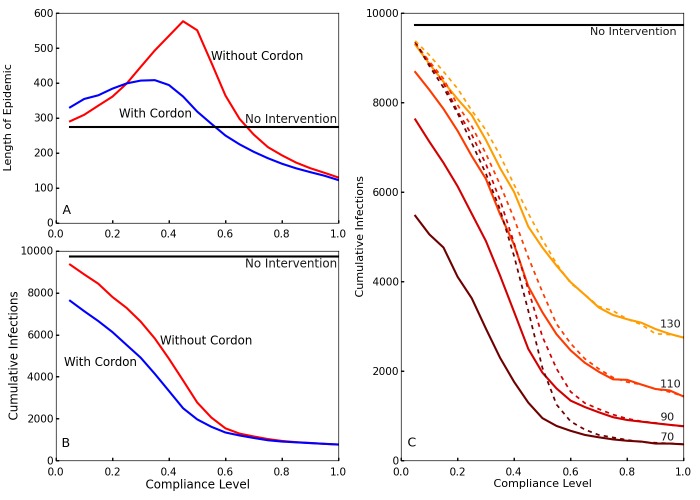
Effect of compliance on epidemic length and cumulative infections with and without travel restrictions for the second set of parameter values (Δ = 10, Γ = 7).

A,B. Simulations with (blue) and without (red) travel restrictions. The travel restrictions compensate for low levels of compliance, and their differences are comparable to Fig. \ref{fig:3} in the main paper. C. The cumulative number of infections over the entire epidemic, as a function of compliance levels and intervention times. Colors from brown to yellow signify intervention times (70, 90, 110, 130). Without enforced travel restrictions (dotted lines), a low compliance results in minimal differences between early and late policy implementation. Travel restrictions (solid lines) dramatically reduce infection numbers for earlier interventions at low compliance. We chose a slightly later set of intervention times $T_0$ for this set of parameters because the mean generation length ($\Delta + \Gamma$) \cite{chowell2014transmission, PMID:17476782} is about 50\% longer, 17 days, compared to the 11 days for the $\Delta = 5$, $\Gamma = 6$ case, so the exponential growth phase begins at a later time.

A,B. Simulations with (blue) and without (red) travel restrictions. The travel restrictions compensate for low levels of compliance, and their differences are comparable to Fig. 3 in the main paper. C. The cumulative number of infections over the entire epidemic, as a function of compliance levels and intervention times. Colors from brown to yellow signify intervention times (70, 90, 110, 130). Without enforced travel restrictions (dotted lines), a low compliance results in minimal differences between early and late policy implementation. Travel restrictions (solid lines) dramatically reduce infection numbers for earlier interventions at low compliance. We chose a slightly later set of intervention times T0 for this set of parameters because the mean generation length (Δ + Γ)49 , 63 is about 50% longer, 17 days, compared to the 11 days for the Δ = 5, Γ = 6 case, so the exponential growth phase begins at a later time.