
FIGURE 3.
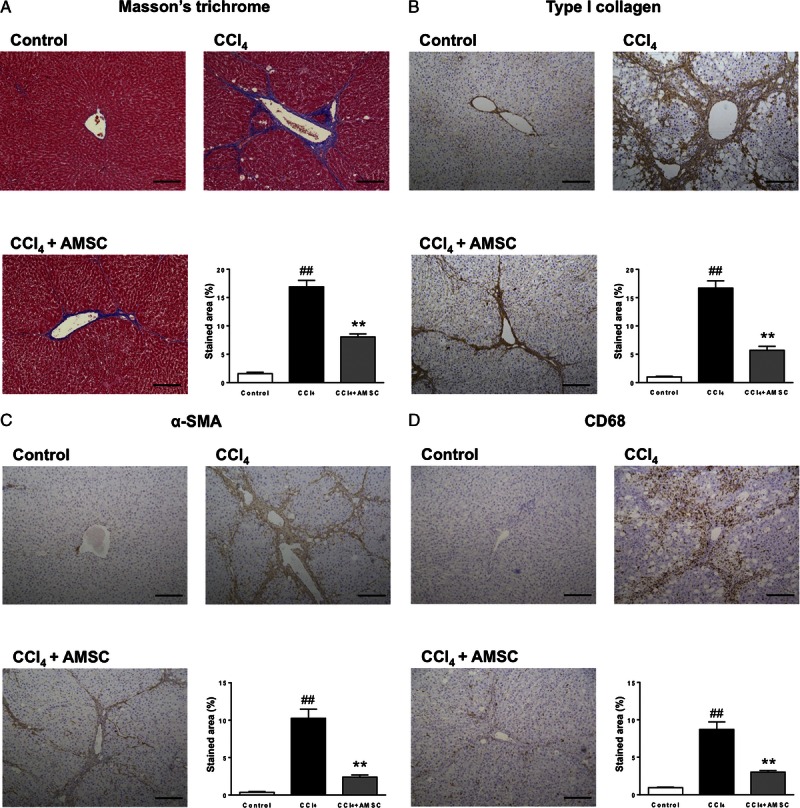
Effect of hAMSC transplantation on histological parameters in CCl4-treated rats (A) Masson’s trichrome staining. Fibrotic area was stained blue and calculated from the entire liver cross-sectional area. Immunohistochemical analyses of (B) Type I collagen, (C) α-SMA and (D) CD68 were performed, and the stained areas were calculated from the entire liver cross-sectional area. Scale bars, 200 μm. The values are reported as the mean ± SEM (n = 6 in control group, n = 12 in CCl4 group, and n = 10 in CCl4 + AMSC group). ##P < 0.01 versus Control group. **P < 0.01 versus CCl4 group.