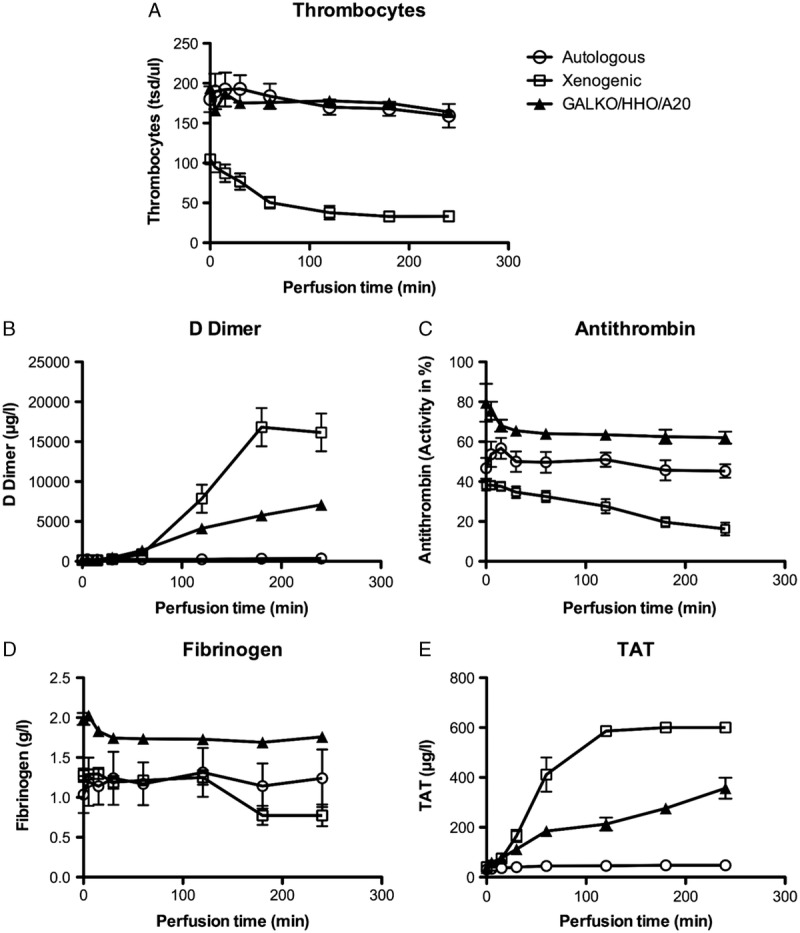
FIGURE 5.

Parameters of coagulation activation during kidney perfusion. A, Thrombocyte counts at defined time points of the perfusion are given for the autologous (circle), xenogeneic (square), and GGTA1-KO/hHO-1/hA20 transgenic perfusion group (triangle). The changes in parameters of coagulation activation in the experimental groups are shown for: (B) fibrinogen, (C) antithrombin activity, (D) D-dimer, and (E) TAT complex. Data for WT-perfusions are from Petersen et al6 and Ramackers et al.16
