FIGURE 1.

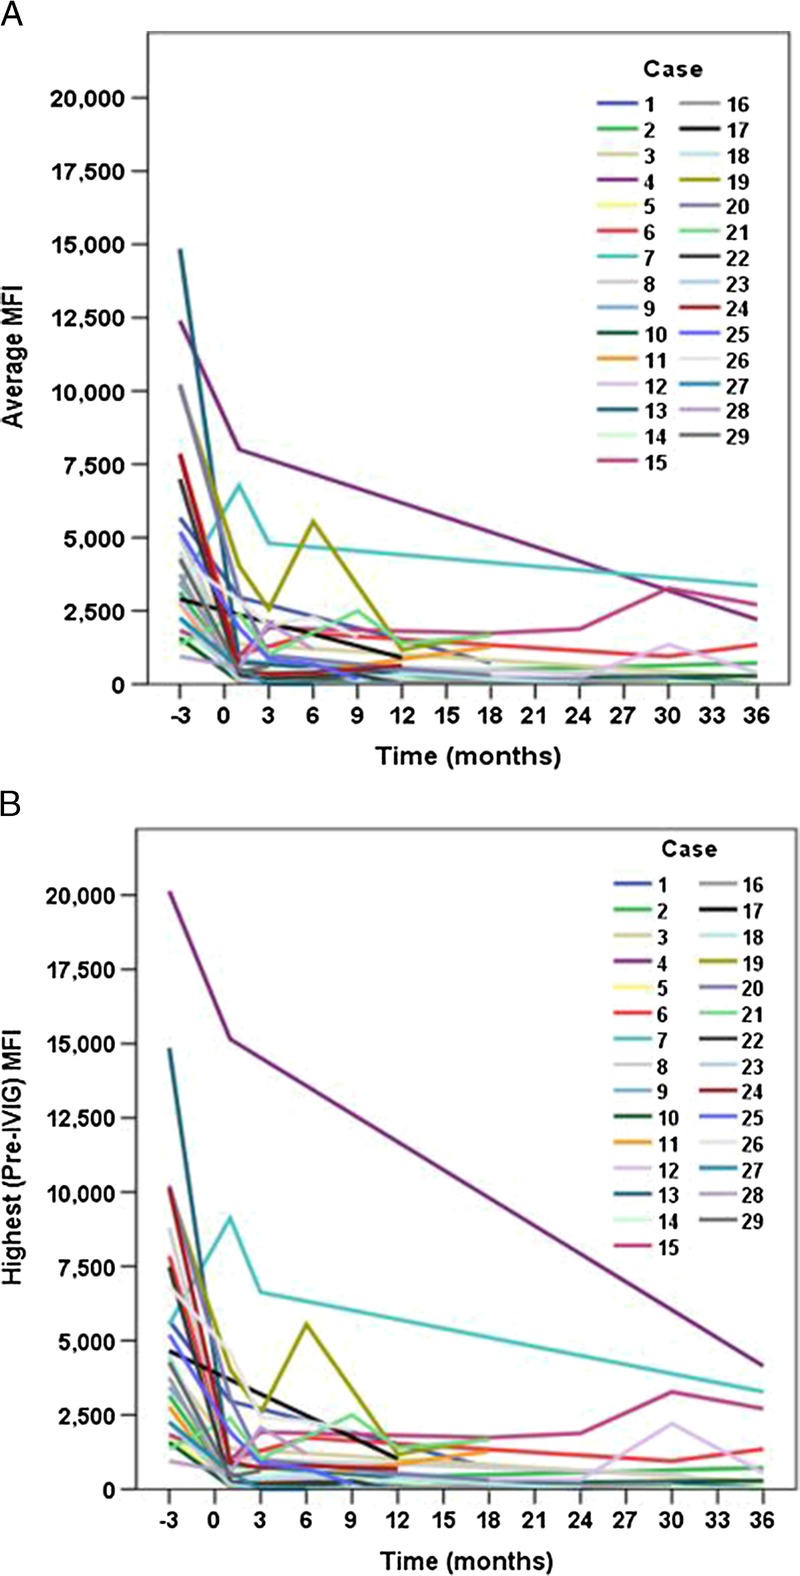
Trajectories of the average/only (panel A) and highest/only (panel B) DSA MFI values over time are shown for each of 29 patients.

Trajectories of the average/only (panel A) and highest/only (panel B) DSA MFI values over time are shown for each of 29 patients.