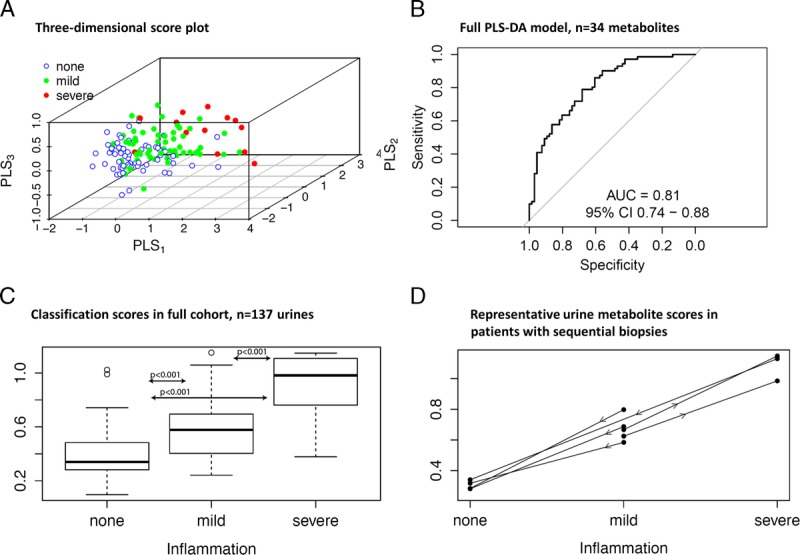
FIGURE 2.

Urinary metabolites distinguish alloimmune inflammation, using a classifier trained on no inflammation versus any inflammation. A, 3D score plot demonstrates separation of no inflammation (blue), from mild (green) and severe (red) inflammation. The diagnostic performance of the (B) Full PLS-DA model (n = 34 metabolites); (C) Performance of the classification scores in the full cohort (n = 137 urines); (D) Representative metabolite scores in patients with sequential biopsies.
