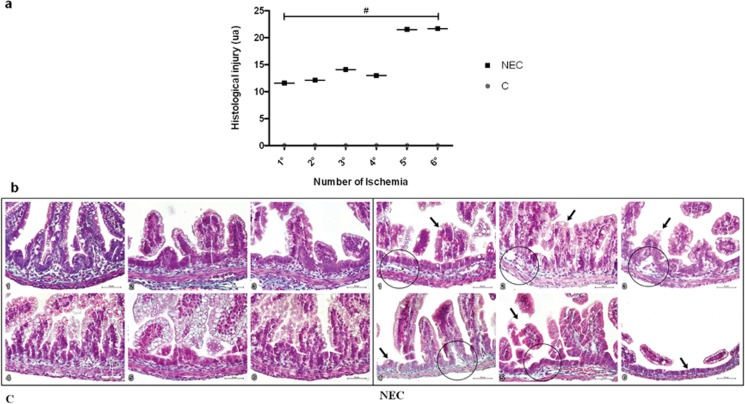
Figure 2.
Lesion scores expressed in arbitrary units (au). a) The differences in the mean injury severity score based on histological analysis were compared at six time points between the Control and NEC groups. The samples were collected at the 1st-6th time points. Graphs of the lesion scores are presented. Note that the Control group exhibited no lesion (score of zero). b) Photomicrographs of histological sections from the C group at the six experimental time points. The samples were collected at the 1st-6th time points. Preserved layers and villi were observed (scale bar=50 μm). Photomicrographs of histological sections of the NEC group at the six experimental time points. 1: first collection time point; edema, separation of the mucosa and submucosa layers, and villus injury were observed. 2: second collection time point; edema, separation of the submucosal layer; peeling and villus injury were observed. 3: third collection time point: edema, separation of the submucosal layer and the lamina propria were observed. 4: fourth collection time point; villus scaling, submucosal layer separation, and decreased thickness of the submucosal and circular muscle layers were observed. 5: fifth collection time point; edema in the mucosal layer, separation of the submucosal layer, and decreased thickness of the circular muscle layer were observed. 6: sixth collection time point; loss of villi (arrows and circles) was observed (scale bar=50 μm). # p<0.0005.

