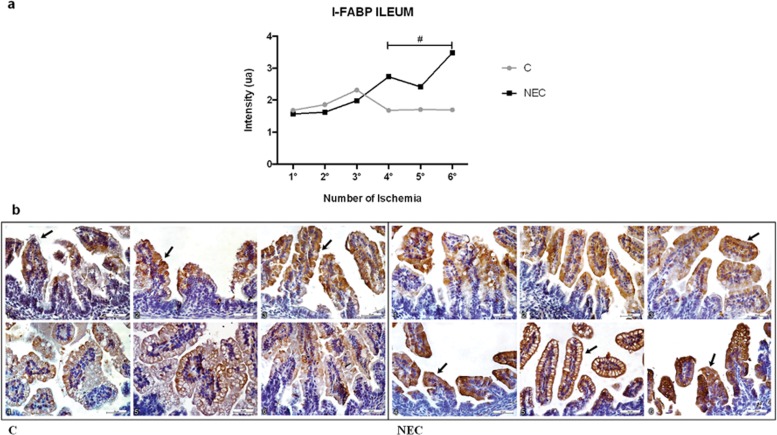
Figure 4.
Graphs of I-FABP expression in the ileum. a) The means and standard deviation of the arbitrary scores of I-FABP immunolabeling intensity (au) in the ileum over three days were compared between the two groups. b) Immunohistochemistry for I-FABP in the ileum relative to the C group. I-FABP immunolabeling intensity increased from the first to the sixth experimental time point (scale bar=50 μm). # p<0.0005.

