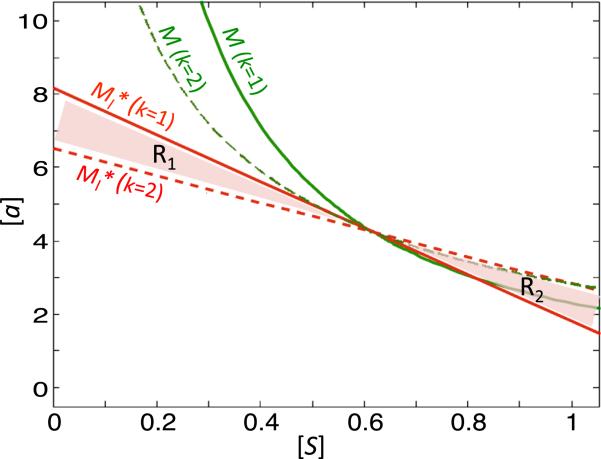
Fig. 8.
Example of dependence of system (9) on k. We consider the system (9) with Pr1 = (ξ1, ξ2, λ, k, β) = (1, 1, 1, 1, 2) (solid lines) and (dashed lines) and plot M (green) and (red). R1 represents the tumor substainability region in the phase space for , but the Allee region for Pr1. Conversely, R2 represents the tumor sustainability region for Pr1, but the Allee region for (Color figure online)

