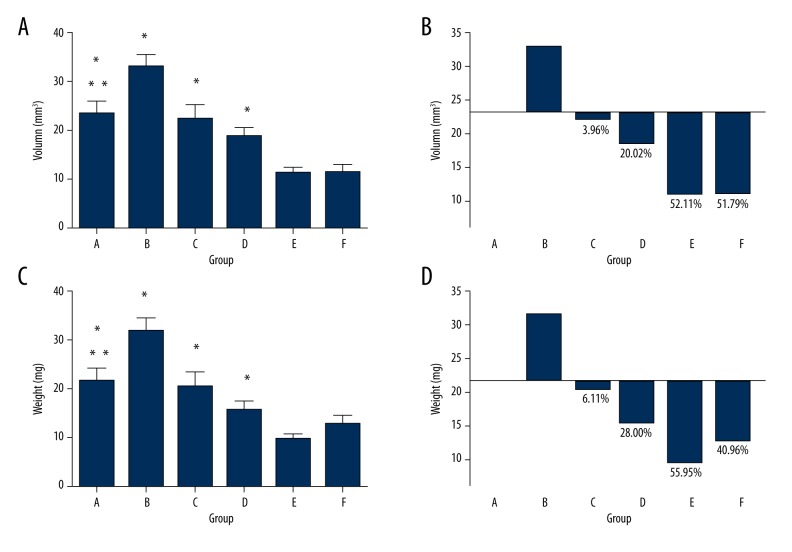
Figure 6.
(A–D) The distribution and the inhibition ratio of the weight and volume of lymph node in each group. * P<0.05 vs. group E, F, ** P<0.05 vs. group B. Figure B and D used the volume and the weight of the lymph nodes of group A as baseline. Over the x axis, the positive half refers to the increases of the volume and the weight, while the other half refers to the inhibition of the weight and the volume. The number equals the inhibition ratio.

