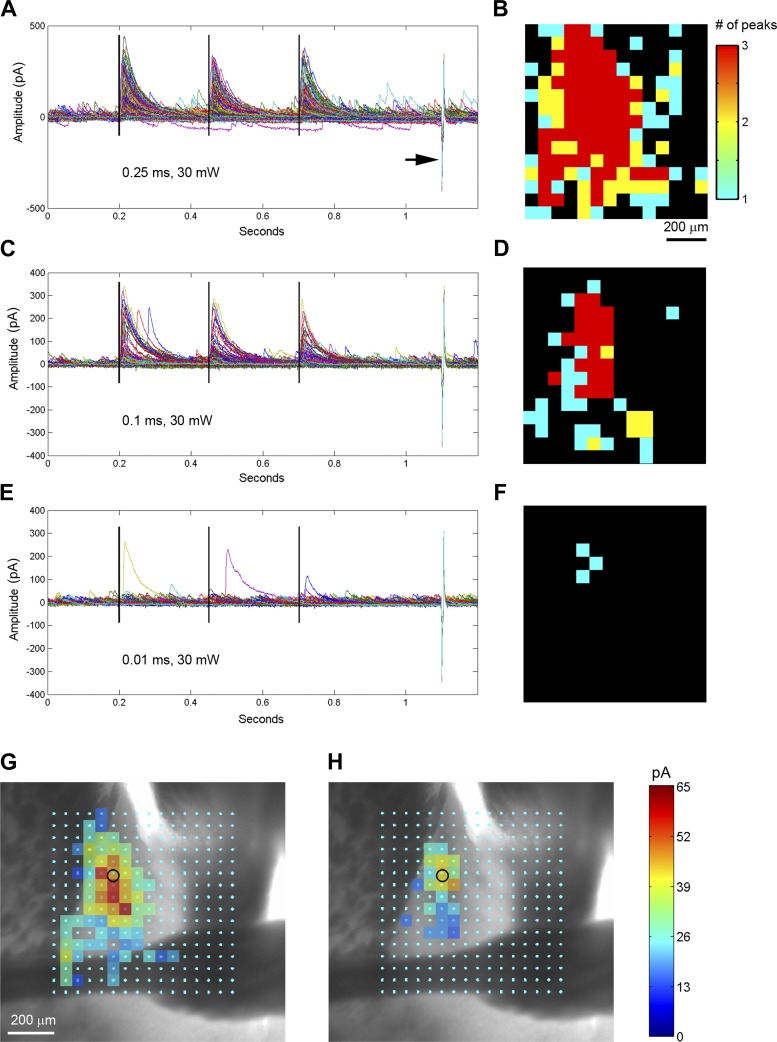
Fig. 7.
Physiological and anatomical calibrations are required for generation of accurate functional maps. A: the plot of all IPSC responses (0.25 ms, 30 mW, Fig. 6C) with baseline subtraction. The three vertical black lines denote the laser stimulation at 200 ms, 450 ms and 700 ms. The recoding access resistance was monitored by a current injection response (5 mV, 5 ms) shown by the arrow. B: the map coding locations with different numbers of detected IPSCs in response to 3 repeated optogenetic stimulation per location. IPSC peaks are detected within the window of between 3 and 50 ms to each laser flash, with an empirically determined threshold of 50 pA. The threshold matched the spontaneous IPSC amplitude shown in E. Only sites with 3 detected IPSCs are selected for further map construction. C and D: the plot of all IPSC responses (0.1 ms, 30 mW, Fig. 6D) are similarly formatted as in A and B, respectively. E and F: the plot of all IPSC responses (0.01 ms, 30 mW, Fig. 6F) are similarly formatted as in A and B, respectively. Under this stimulation condition (0.01 ms), no single location showed repeated IPSC responses, indicating insufficient laser power for robust circuit mapping. G and H: the SOM+ inhibitory input response sites (B, D) are overlaid on the bright-field image to show anatomical position. The small black circle indicates the cell body location. The scale codes the average peak IPSC amplitude. Presence of stimulation response in the anterior commissure in G indicates nonspecific input mapping under the high-power laser condition.

