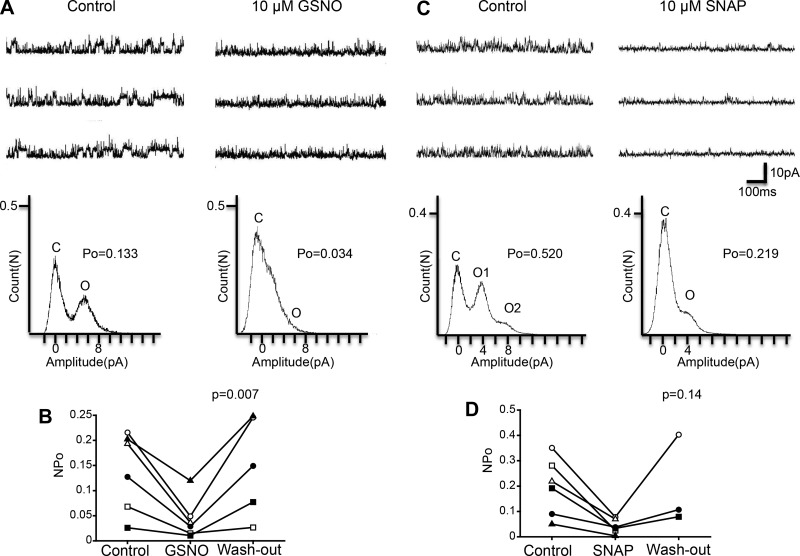
Fig. 1.
Effect of the NO donors GSNO and SNAP on KNa channel activity in isolated Kenyon cells. A, top: representative traces of KNa channel current in the control (left) and 10 μM GSNO (right) groups. Bottom: corresponding all-point amplitude histograms. C and O, closed and complete opening levels, respectively. B: NPo before the application of GSNO (Control), in the presence of 10 μM GSNO (GSNO), and after washout of GSNO (Wash-out). Matching symbols connected with a line show the sequential experiment in the same cell. C, top: representative traces of KNa channel current in the control (left) and 10 μM SNAP (right) groups. Bottom: corresponding all-point amplitude histograms. D: NPo before application of SNAP (Control), in the presence of 10 μM SNAP (SNAP), and after washout of SNAP (Wash-out). B and D: repeated-measures ANOVA.

