Fig. 4.
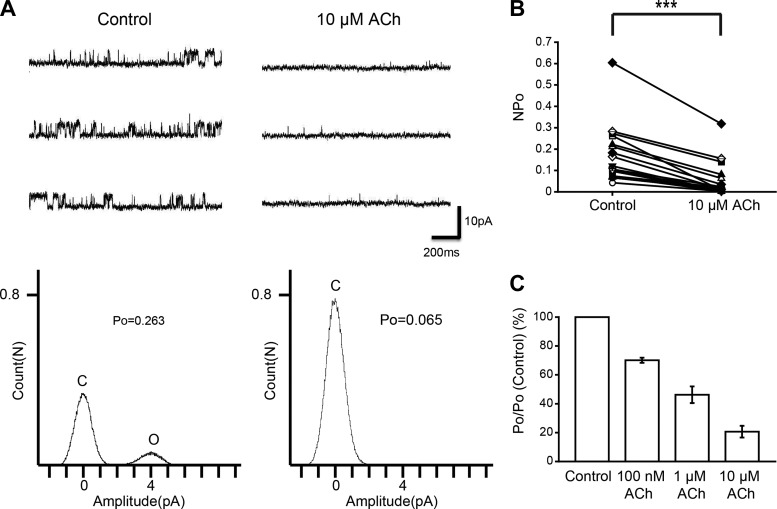
Effect of ACh on KNa channel activity in isolated Kenyon cells. A, top: representative traces of KNa channel current in the control (left) and 10 μM ACh (right) groups. Bottom: corresponding all-point amplitude histograms. C and O, closed and complete opening levels, respectively. B: NPo before drug application (Control) and in the presence of 10 μM ACh. Matching symbols connected with a line show the sequential experiment in the same cell. C: dose-response relationship between ACh concentration and the average relative Po of KNa channel currents. B: paired t-test; ***P < 0.001.

