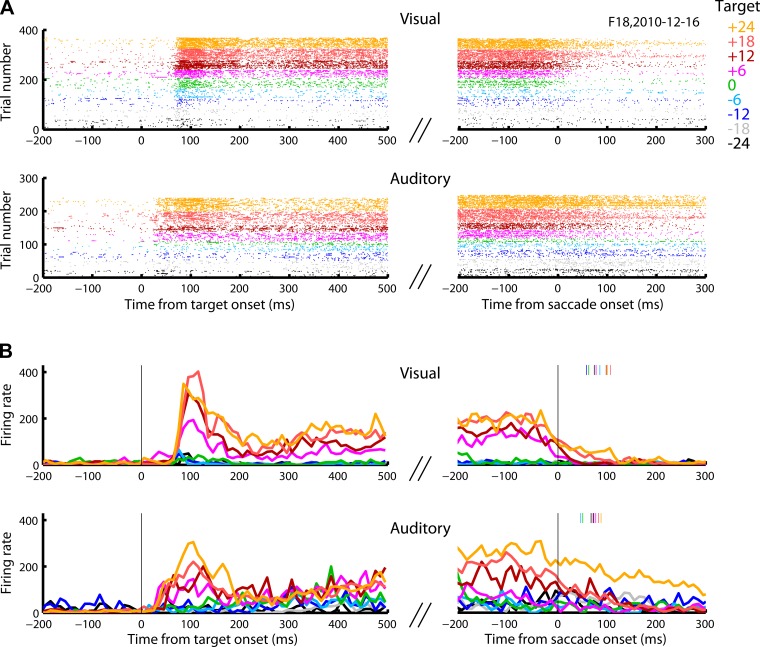
Fig. 3.
Raster plot and perievent time histogram (PETH) of an example cell. This cell responded vigorously to the onset of contralateral visual and auditory targets. The activity persisted in time until a saccade was made. A: raster plots for visual and auditory trials aligned to the target and the saccade onset. B: PETH for visual and auditory trials aligned to the target and the saccade onset. PETH were obtained by averaging the number of action potentials within running bins of 10 ms aligned to the target onset or saccade onset [smoothed using a half-triangular filter (2/3, 1/3). The points were attributed to the time of the value receiving the 2/3 weight]. Colors indicate horizontal target locations. The colored tick marks in B indicate the average saccade offset for each target location.

