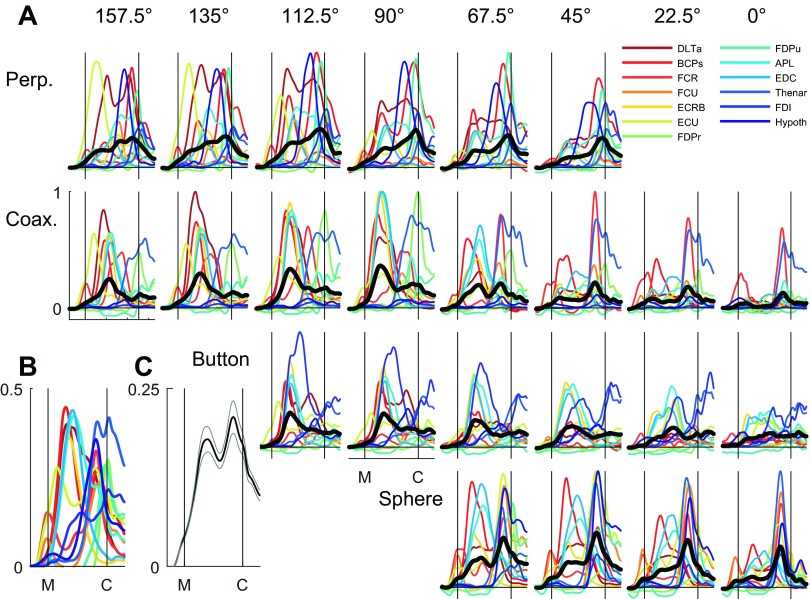
Fig. 4.
Averaged EMG activity. A: normalized EMG activity for each of 13 simultaneously recorded muscles (colored traces) is shown averaged across all successful trials for each of the 24 location–object combinations. For each combination, the black trace is the average across all 13 individual muscle averages. B: EMG activity for each muscle here has been averaged across all 24 combinations. C: grand average across all muscles and all location–object combinations, i.e., across all trials. Light gray lines indicate ±1 SE of the mean across the 24 location–object combination averages (black traces in A). Note that because EMG activity was relatively low much of the time in most muscles, the more the data were averaged, the lower the averaged values, and therefore, the ordinate scales differ in A (0–1), B (0–0.5), and C (0–0.25). All of the data shown here are from session L20120928.

