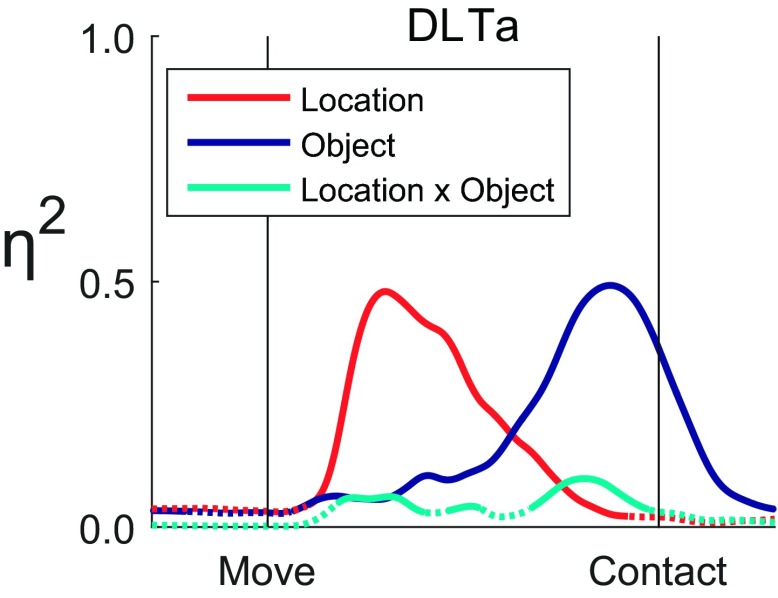
Fig. 5.
Effect sizes, η2, as a function of time for the anterior deltoid (DLTa). The traces of effect size for location (red), object (blue), and their interaction (cyan) each are dotted when insignificant and solid when significant. An early peak in location effect was followed by a later peak in object effect, whereas the interaction effect remained comparatively small. Vertical lines indicate the time of movement onset (Move) and the time of contact with a peripheral object (Contact). The underlying data are shown in Fig. 3.

