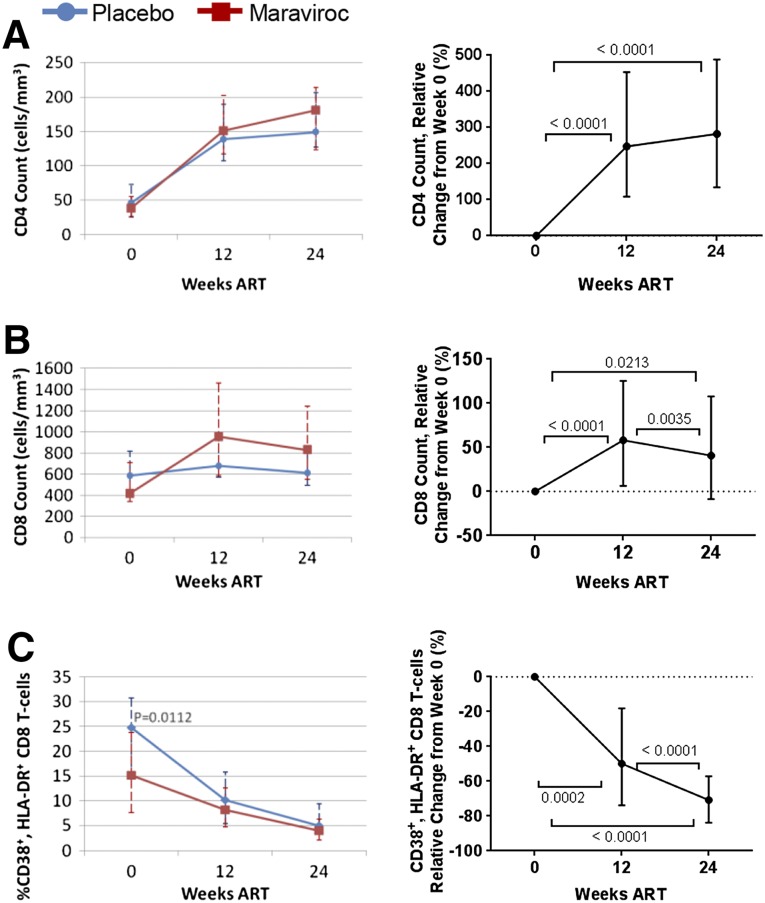
Figure 1. T cell count and CD38+, HLA-DR+ CD8 T cells during ART.
Shown are placebo (blue) versus maraviroc (red) group CD4 count (A), CD8 count (B), and percentage of CD38+, HLA-DR+, and CD8 T cells (C), absolute values and change relative to baseline. Median and interquartile range are displayed. Only patients with all (wk 0, 12, and 24) time points are shown. Mann-Whitney U comparison between groups was performed at each time point, with P < 0.05 considered significant and displayed (left). Longitudinally, Friedman test and post hoc Dunn test were performed, with P < 0.05 considered significant and displayed (right).

