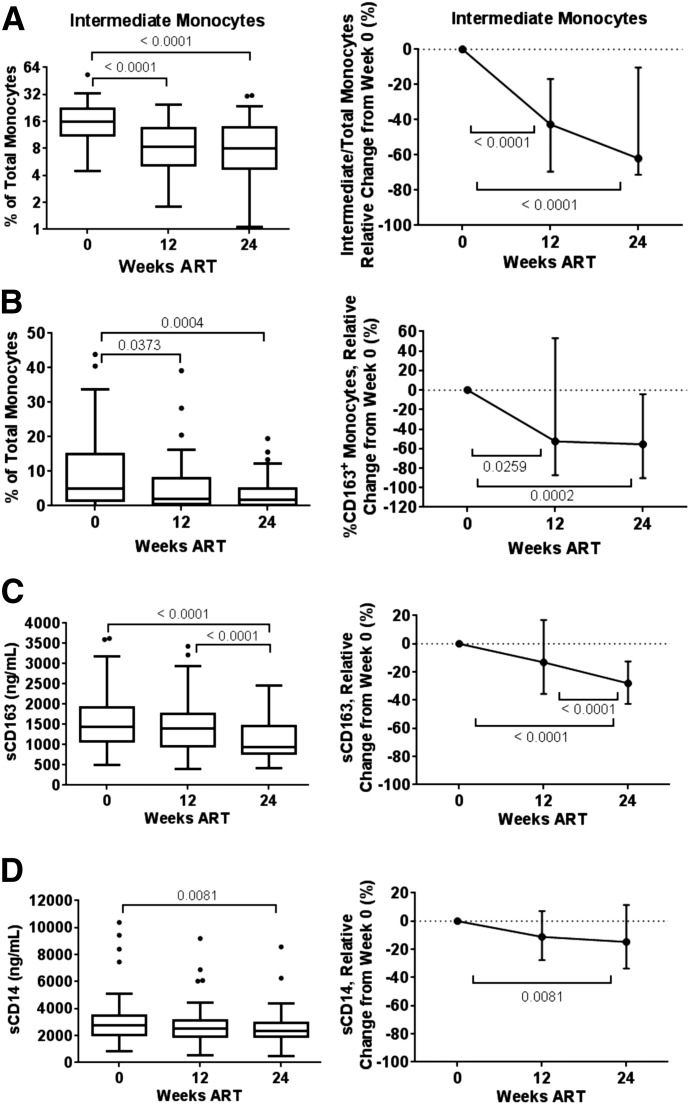
Figure 2. Monocyte and macrophage activation markers during ART.
Shown are percentage of CD14++CD16+ intermediate monocytes (A), CD163+ monocytes (B), plasma sCD163 (C), and plasma sCD14 (D), absolute and relative to baseline change. Longitudinal comparisons display median and interquartile range with Tukey’s method using the Friedman test and Dunn post hoc test, with P < 0.05 considered significant and displayed.

