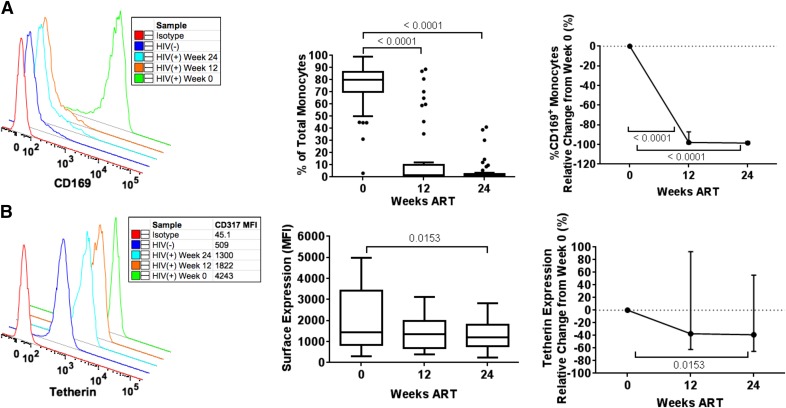
Figure 3. ART reduction of monocyte ISG markers.
Shown are the percentage of CD169+ monocytes (A) and tetherin expression (B) with representative donors (left), absolute values (middle), and change relative to baseline (right) during 24 wk of ART. Longitudinal comparisons display median and interquartile range with Tukey’s method using the Friedman test and Dunn post hoc test, with P < 0.05 considered significant and displayed.

