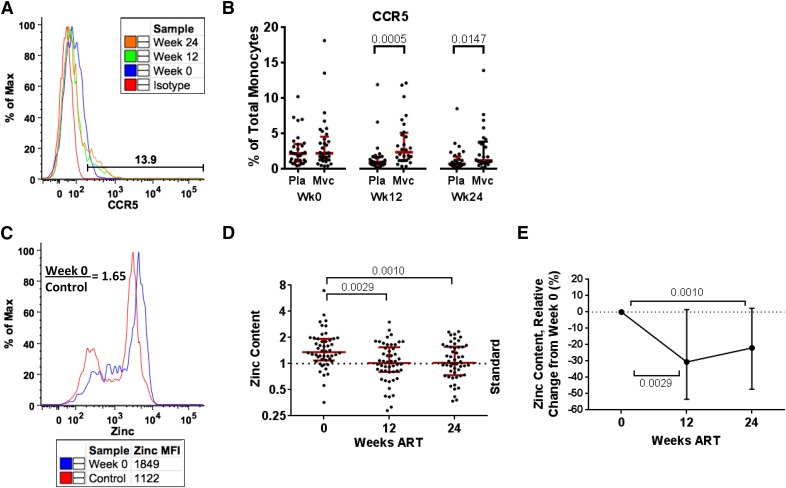
Figure 4. ART impact on monocyte apoptosis-resistance mechanisms.
CCR5 expression is displayed in a representative maraviroc (Mvc) patient (A) and the total cohort (B) during 24 wk of ART in placebo (Pla) versus maraviroc groups. Median and interquartile range are shown, and group comparison was performed using the Mann-Whitney U test, with P < 0.05 considered significant and displayed. Monocyte zinc content is shown [representative (C), relative value (D), relative change (E)] during 24 wk of ART. The dotted, horizontal lines (D and E) represent the MFI of the HIV(−) standard repeated during each experiment. Longitudinal comparisons display median and interquartile range using the Friedman test and Dunn post hoc test, with P < 0.05 considered significant and displayed.

