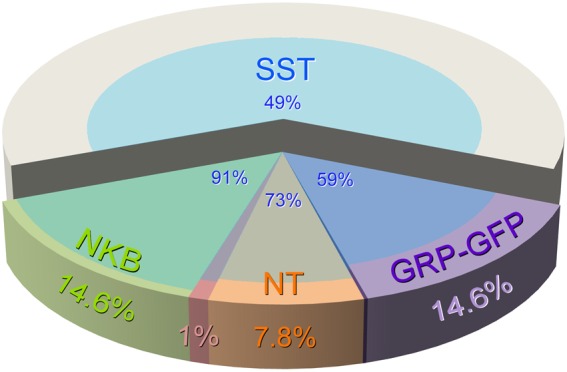
Figure 9.

Proportions of excitatory neurons in laminae I–II that belong to different neurochemical populations. The pie chart shows the proportions of all excitatory interneurons in laminae I–II that are accounted for by each neurochemical population. Note that there is no overlap between GRP-EGFP and NKB-expressing (PPTB-immunoreactive) populations, but a minimal overlap between each of these and the neurotensin population. In contrast, SST is expressed by the majority (59%–91%) of cells in each of the other peptide populations, as well as by many (49%) of those that lack these other peptides.
