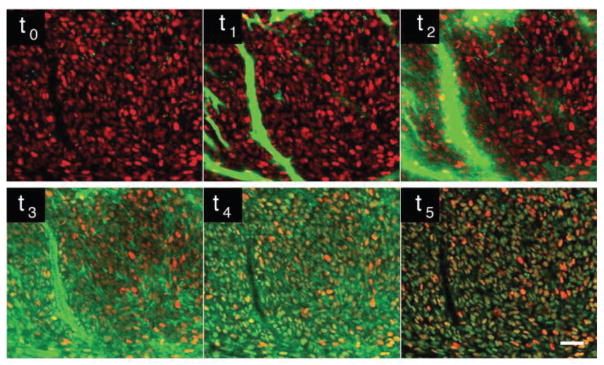
Fig. 1.
Time lapse imaging of in vivo drug distribution of a PARP inhibitor in a H2B-RFP implanted tumor, over the course of three hours. Within a few minutes after injection the drug (green) accumulates within the H2B-RFP cells (RFP, red). After a few hours the non-specifically bound drug clears out from the cells and only drug within the nuclei of the H2B-RFP cells is maintained, suggesting the drug has bound to its target. t0 before drug injection, t1 20 seconds after injection, t2–t5 at respectively 2, 14, 40 and 150 minutes. Adapted and reprinted with permission from [14].

