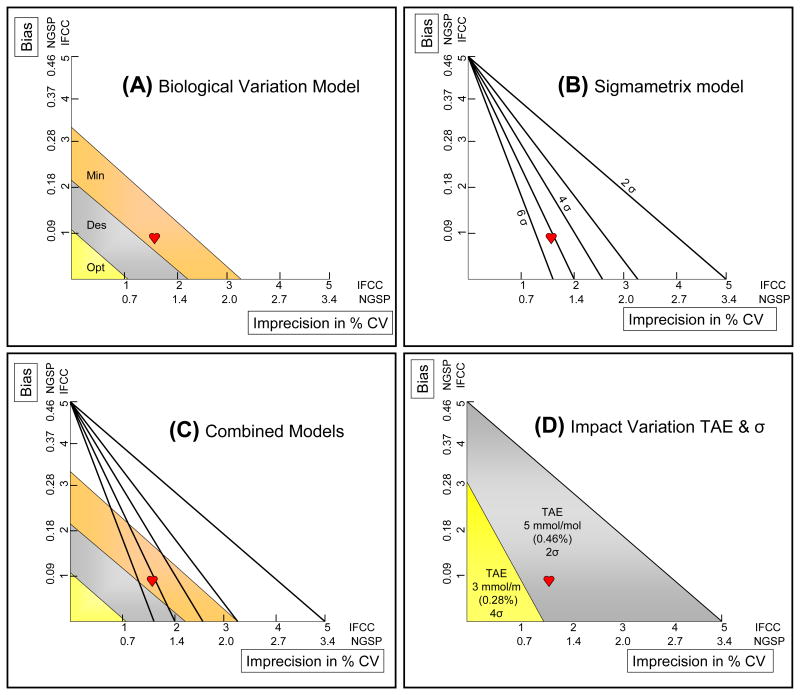
Fig. 1. Quality Target Models.
Imprecision in %CV on the x-axis and bias in mmol/mol (IFCC) and % (NGSP) on the y-axis. Quality Targets are shown in colors for the Biological Variation model (Panel A; optimum, desirable, minimum) and with lines for the Sigma-metrics model (Panel B; 2 – 6 σ). Panel C combines both models.The red heart represents the performance of a laboratory with a bias of 1 mmol/mol (0.9%), an imprecision of 1.5% (1.0%) and a TE of 2.5 mmol/mol (0.23%) and meets the “minimum” performance criterion in the Biological Variation model and the “5σ” criterion in the Sigma-metrics model. Panel D shows the impact of varying the set TAE and acceptable σ value on performance.

