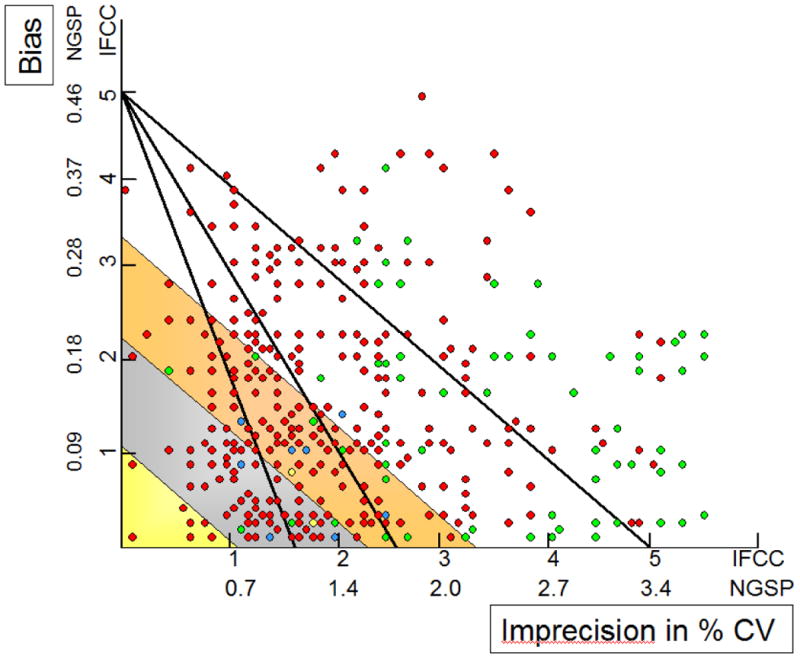
Fig. 3. Models applied to 342 individual laboratories.

Each dot represents an individual laboratory: HPLC (red), Immunoassay (green), Affinity Chromatography (yellow), Capillary Electrophoresis (blue). For reasons of simplicity only 2, 4 and 6σ limits for TAE = 5 mmol/mol (0.46%) of the Sigma-metrics model are shown. Yellow, grey and amber are the limits of optimum, desirable and minimum performance of the biological variation model. Data from the shared 2013 EQA program in Belgium, the Netherlands, Greece and Finland.
