
Figure 5.
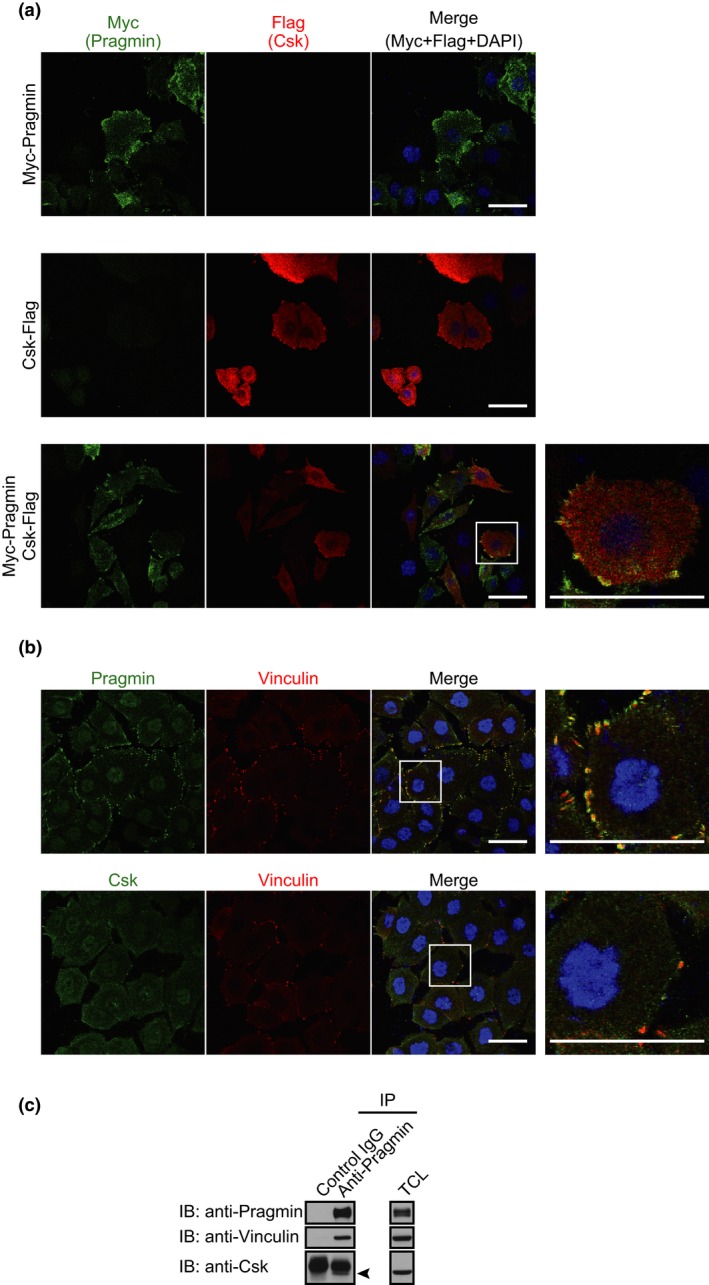
Distribution of Pragmin and C‐terminal Src kinase (Csk) to focal adhesions. (a,b) Confocal x‐y images are shown. Scale bar = 50 μm. (a) Immunostaining analysis of AGS human gastric epithelial cells infected with indicated lentiviruses. Anti‐Myc antibody (green), anti‐Flag antibody (red), DAPI (blue). (b) Immunostaining analysis of AGS cells. Upper, anti‐Pragmin antibody (green), anti‐vinculin antibody (red), DAPI (blue). Lower, anti‐Csk antibody (green), anti‐vinculin antibody (red), DAPI (blue). (c) Immunoprecipitation (IP)–immunoblot analysis of endogenous Pragmin in AGS cells. Arrowhead indicates the position of Csk. TCL, total cell lysates.