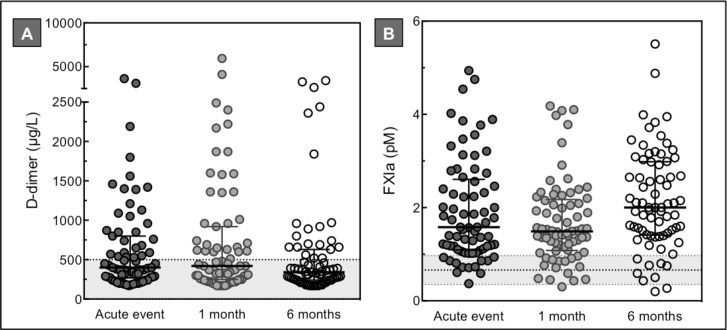
Fig 4. Factor XIa and D-dimer levels in ACS patients during follow-up.
D-dimer (A) and factor XIa (B) measurements of plasma collected from 73 ACS patients during the acute event and after 1 and 6 months follow-up. The horizontal dotted lines represent the D-dimer cut-off value of 500 μg/L (A) and the mean factor XIa level ± SD in a group of healthy individuals, n = 30 (B). Horizontal lines indicate means ± SD (B), or medians ± IQR (A). Differences between baseline and follow-up measurements were established by repeated measured ANOVA or Friedman test with multiple comparison analysis. * p<0.05.

