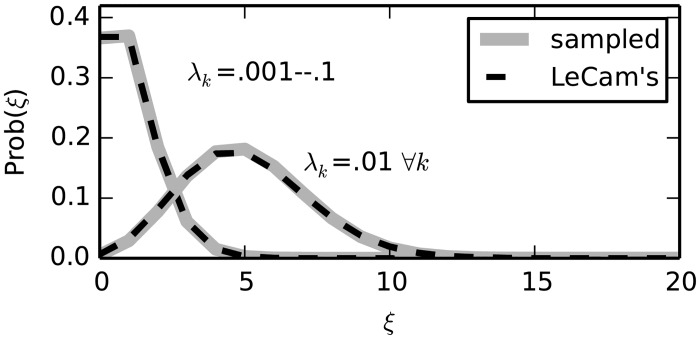
Fig 2. Le Cam’s approximation.
The continuous gray curves show two Poisson Bernoulli distributions resulting from the sum of 100 Bernouilli random variables, having rates λk = 0.01 ∀k (right curve) and λk = 0.001, 0.002, …, 0.1 (left curve), respectively. The distributions are drawn as histograms from samples of size 108 (calculating their exact analytical expression as in Eq 2 exact is computationally prohibitive). In both cases, Le Cam’s approximation given by a Poisson distribution with parameter λ = ∑k λk (dashed lines) yields a good match (integrated absolute error <0.04).

