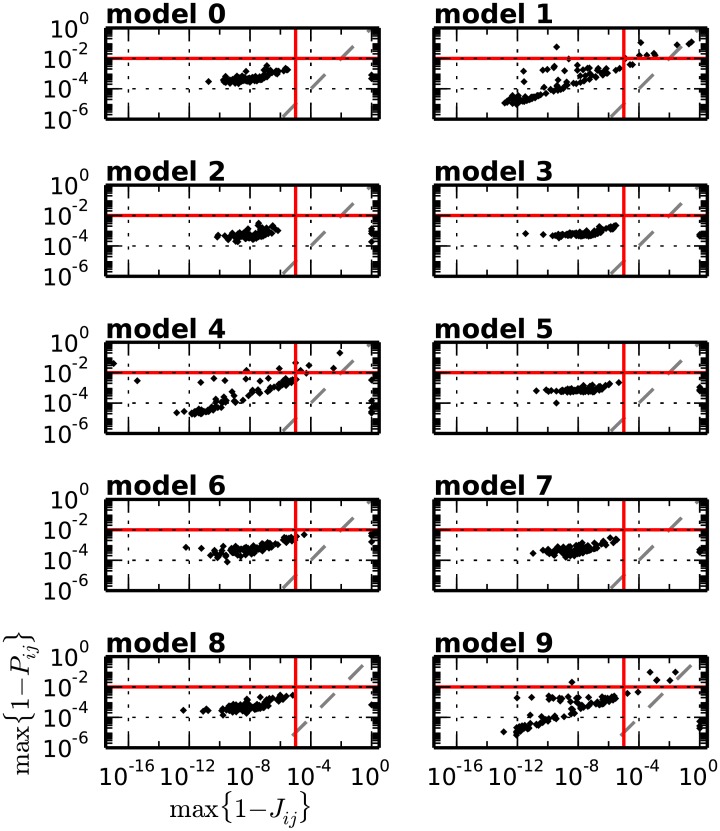
Fig 9. Scatter of the upper-tail probabilities of the two tests in the presence of a repeated SSE.
The upper tail probability of the first test (y-axis) in relation to that of the second test (x-axis) for all models 0, …, 9. Each model is repeated 100 times and in each repetition an SSE composed of 7 links and 5 neurons/link is injected at two random points in time. The represented values max(1 − Pik, jk) and max(1 − Jik, jk) are taken each as the maximum (i.e. least significant) significance value across all entries of the intersection matrix composing the embedded DS. The figure shows for each model the cloud of the 100 points (max(1 − Jik, jk), max(1 − Pik, jk)), one per simulation. The red lines mark the significance levels 1 − α1 (horizontal) and 1 − α2 (vertical) for individual tail probability values 1 − Pij and tail joint probability values 1 − Jij, respectively.

